
Fig. 4
- ID
- ZDB-FIG-120412-34
- Publication
- Camp et al., 2012 - Intronic Cis-Regulatory Modules Mediate Tissue-Specific and Microbial Control of angptl4/fiaf Transcription
- Other Figures
- All Figure Page
- Back to All Figure Page
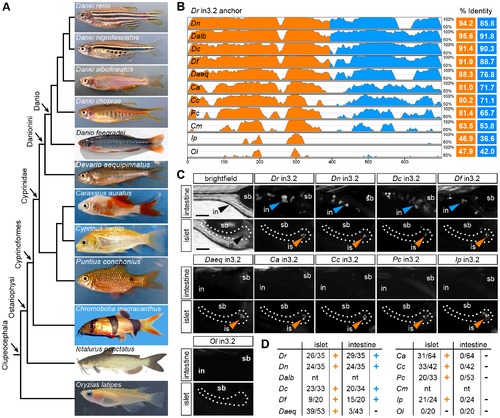
Functional evolution of the islet and intestinal regulatory modules in 12 fish species. (A) Unscaled phylogram based on information from [58], [59] showing images and relative relationships of 12 fish for which intronic sequences were analyzed. Danio rerio (Dr, zebrafish), Danio nigrofasciatus (Dn), Danio albolineatus (Dalb), Danio choprae (Dc), Danio feegradei (Df), Devario aequipinnatus (Daeq, giant danio), Carassius auratus (Ca, goldfish), Cyprinus carpio (Cc, carp), Puntius conchonius (Pc, rosy barb), Chromobotia macracanthus (Cm, clown loach), Ictalurus punctatus (Ip, channel catfish), Oryzias latipes (Ol, medaka). (B) VISTA plot displaying the global pairwise alignment of orthologous in3.2 regions from each species anchored to zebrafish (Dr) in3.2. Orange peaks correspond to regions in the alignment that correspond to Dr in3.3 (islet module). Blue peaks correspond to regions in the alignment that correspond to Dr in3.4 (intestine module). Percent identity is calculated from pairwise alignments of each module with zebrafish (VISTA parameters: 25 bp sliding window, LAGAN alignment). (C) Representative islet and intestinal images from injections of each orthologous in3.2 module. Orange or blue arrowheads mark positive islet or intestine expression, respectively. The absence of arrowheads denotes negative expression in each tissue. (D) Summary of mosaic expression for each species. Ratios of islet or intestine positive fish versus total fish expressing gfp are shown. Orange or blue (+) denotes that the construct was sufficient to confer expression in the islet or intestine, respectively. Black (-) denotes insufficiency. Note that Dalb and Cm sequences were not tested (nt) in this heterologous functional assay. See also Figures S5 and S6. |