
Fig. 3
- ID
- ZDB-FIG-120412-33
- Publication
- Camp et al., 2012 - Intronic Cis-Regulatory Modules Mediate Tissue-Specific and Microbial Control of angptl4/fiaf Transcription
- Other Figures
- All Figure Page
- Back to All Figure Page
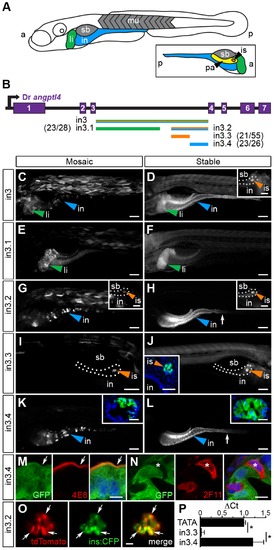
Non-overlapping regulatory modules within angptl4 intron 3 confer liver, islet, and enterocyte-specific reporter expression. (A) Depiction of the 6 dpf zebrafish showing liver (li, green), intestine (in, blue), swim bladder (sb, grey), and muscle (mu, grey), with the fish oriented anterior (a) to the left and posterior (p) to the right. The opposite orientation reveals the exocrine pancreas (pa, yellow) and islet (is, orange). (B) Scaled schematic of the zebrafish angptl4 locus and non-coding DNA assayed for regulatory potential. Modules are color coded according to the tissues in which they confer expression. Ratios of islet or intestine positive fish versus total fish expressing gfp are shown in parentheses next to truncation labels. (C–N) Representative images of GFP reporter expression in mosaic (column 1) and F1 stable (column 2) animals driven by each non-coding DNA region (rows). Scale bars = 100 μm; li = liver, is = islet, in = intestine, sb = swim bladder. Colored arrowheads indicate tissue with specific reporter expression. (C–D) Full-length intron 3 (in3; 2,136 bp) is sufficient to promote expression of the reporter in the liver, islet (D, inset, scale bar = 50 μm), and intestine. (E–F) Truncation in3.1 (1,219 bp) confers expression in the liver. (G–H) Truncation in3.2 (701 bp) confers expression in both the intestine and islet (H, inset). Inset scale bar = 50 μm. (I–J) Truncation in3.3 (387 bp) confers islet expression. A transverse section (inset, J) reveals islet expression (nuclei stained with DAPI). Inset scale bar = 50 μm. (K–L) Truncation in3.4 (316 bp) confers intestinal expression. Insets in panels K and L contain transverse sections showing expression localized to the intestinal epithelium (nuclei stained with DAPI). Inset scale bar = 25 μm. The dotted lines in panels D, G, H, and I outline the pancreas. The white arrows in panels H, K, and L mark the boundary between the anterior intestine (segment 1) and mid-intestine (segment 2). (M–N) Cells expressing GFP driven by the in3.4 regulatory module colocalize with a marker (4E8, red, white arrow) of the brush border of absorptive enterocytes, but fail to co-localize with marker for secretory cells (2F11, red, asterisk). Nuclei stained with DAPI. Scale bars = 5 μm. (O) Intercross of Tg(in3.2-Mmu.Fos:tdTomato) with β-cell specific reporter line (Tg(ins:CFP-NTR)s892) show colocalization of tdTomato and CFP in the islet. Scale bars = 10 μm. (P) Quantitative PCR shows that the in3.4 module and the angptl4 promoter (TATA box), but not the in3.3 module, are hypersensitive to DNase I cleavage in intestinal epithelial cells isolated from adult zebrafish. Asterisks denote P-value<.01 from unpaired T-tests between TATA box or in3.4 and in3.3 regions. Error bars represent standard deviation from four biological replicates using cells pooled from 3 wild-type adult zebrafish per replicate. |
| Genes: | |
|---|---|
| Fish: | |
| Anatomical Terms: | |
| Stage: | Day 6 |