
- Title
-
Ovo1 links Wnt signaling with N-cadherin localization during neural crest migration
- Authors
- Piloto, S., and Schilling, T.F.
- Source
- Full text @ Development

Expression profile of ovo1. Wholemount in situ hybridization. (A) Enveloping layer (EVL) expression at 5 hours post-fertilization (hpf). (B) Neural crest (NC) and prechordal plate (PCP) expression at 10 hpf (dorsal view, anterior to the left). (C,D) Expression in premigratory cranial NC cells at 12 hpf (C, dorsal view; D, lateral view). (E,F) Expression in migrating cranial NC cells at 15 and 24 hpf (dorsal views). Additional expression at 24 hpf in otic vesicles (ot) and roof plate (rp; F, arrows). (G,H) Expression at 48 hpf in pharyngeal arches (pa), pectoral fins (pf), otic vesicles and neurocranium (ne; G, lateral view; H, ventral view). e, eye. EXPRESSION / LABELING:
|
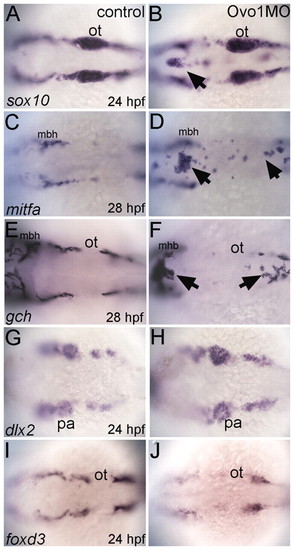
Ovo1 is required for the migration of NC-derived pigment precursors. Dorsal views, anterior to the left. (A,C,E,G,I) Controls; (B,D,F,H,J) Ovo1 morphants. Embryos were processed by wholemount in situ hybridization for expression of sox10 (A,B), mitfa (C,D), gch (E,F), dlx2 (G,H) and foxd3 (I,J). NC cells migrate in bilateral streams in control embryos (A), but aggregate in the dorsal midline of Ovo1 morphants (B, arrow). Pigment precursors, which express mitfa and gch at 28 hpf, form ectopic clumps in the dorsal midline in Ovo1 morphants (D,F arrows) when compared with wild-type controls (C,E). However, skeletogenic and glial precursors, which express dlx2 and foxd3 at 24 hpf, respectively, do not form clumps in the midline in Ovo1 morphants (G-J). mbh, midbrain-hindbrain boundary; ot, otic vesicle; pa, pharyngeal arches. |
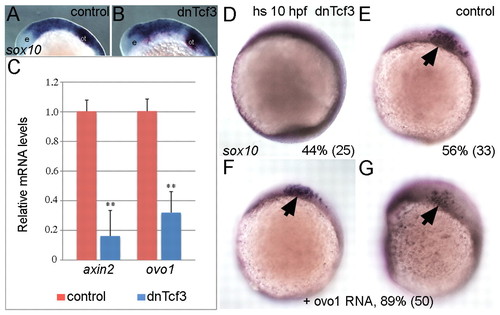
ovo1 is induced by Wnt signaling and Ovo1 overexpression partially rescues loss of Wnt signaling in NC cells. (A,B) sox10 expression appears identical in controls and embryos overexpressing a heat-shock-inducible form of the dominant-negative form of Tcf3 (dnTcf3), heat-shocked at 12 hpf. e, eye; ot, otic vesicle. (C) Real-time PCR shows reduced ovo1 RNA levels in embryos overexpressing dnTcf3 (blue bars) when compared with wild-type siblings (red bars). Similar reductions occur for axin2 mRNA, a direct Wnt target. (D,E) Loss of sox10 expression in NC in dnTcf3-injected embryos heat-shocked at 10 hpf (D), compared with controls (E, arrow). Percentages in lower right corners indicate phenotype frequency with number of embryos in parentheses. (F,G) Rescue of sox10 expression in NC (arrows) in heat-shocked, dnTcf3-injected embryos overexpressing ovo1 (**, P≤0.01). EXPRESSION / LABELING:
|
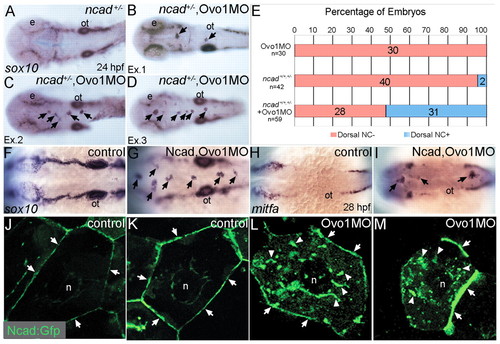
Interactions between Ovo1 and Ncad. (A-I) Ovo1 genetically interacts with Ncad. (A-G) In situ hybridization for sox10 expression. In both wild types and heterozygous ncad+/- mutants (A), sox10 expression marks bilateral stripes of migrating NC at 24 hpf. Dorsal views, anterior to the left. (B-D) In ncad+/- heterozygotes injected with subthreshold levels of Ovo1 MO, a subset of sox10-positive NC cells remains at the dorsal midline [arrows; examples (Ex) 1-3]. (E) Quantitation of wild-type (red bars) and ectopic dorsal (blue bars) sox10+ NC cells. In contrast to controls (F), ectopic sox10+ cells (G) cluster in the dorsal midline in embryos injected with subthreshold levels of both Ovo1 and Ncad MOs. (H,I) In situ hybridization for mitfa expression. In contrast to controls (H), ectopic cells at the dorsal midline express mitfa (I, arrows). (J-M) Ovo1 regulates Ncad localization. Confocal images of EVL cells in embryos injected with Ncad:Gfp. Ncad:Gfp localizes to the membrane (arrows) and perinuclear region (n, nucleus) of control cells (J,K), whereas Ncad:Gfp accumulates in the cytoplasm of Ovo1 morphant cells (L,M arrowheads). e, eye; n, nucleus; ot, otic vesicle. EXPRESSION / LABELING:
PHENOTYPE:
|
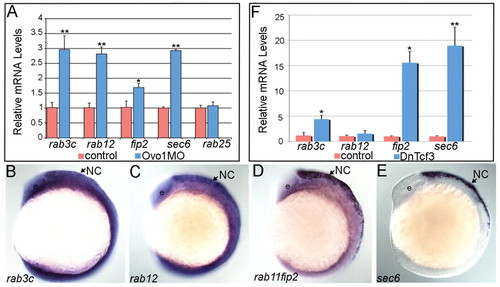
Ovo1 and Wnt signaling regulate expression of genes involved in intracellular trafficking. (A) Real-time PCR in Ovo1 morphants reveals elevated expression levels of rab3c, rab12, rab11fip2 and sec6 mRNA levels (blue bars), compared with controls (red bars), whereas rab25 levels do not change. (B-E) In situ hybridization for expression of rab3c (B), rab12 (C), rab11fip2 (D) and sec6 (E) in NC cells (arrows) at 13 hpf. Lateral views, anterior to the left. e, eye. (F) Inhibition of Wnt signaling using heat-shock-inducible dnTCF (Tg(hs:dnTcf-GFP)w26) increases rab3c, rab11fip2 (indicated as fip2) and sec6 expression (blue bars), but not rab12, compared with wild-type siblings (red bars). *, P≤0.05; **, P≤0.01. EXPRESSION / LABELING:
|
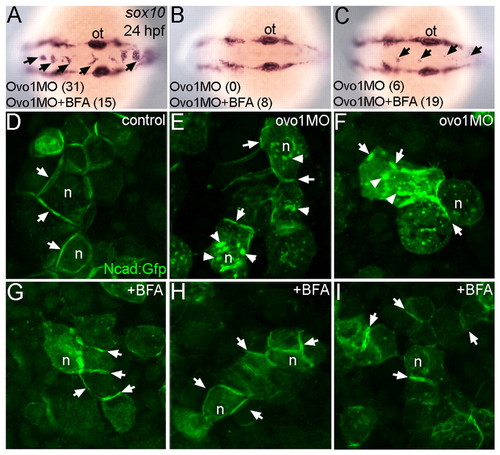
Inhibition of intracellular trafficking rescues the Ovo1 morphant phenotype. (A-C) In situ hybridization for sox10 at 24 hpf. Dorsal views, anterior to the left. Percentages of embryos with NC cell aggregates at the dorsal midline (arrows) with or without BFA treatment are indicated at the bottom of each panel. (A) A severe example with >5 cells per aggregate over both the midbrain and hindbrain. (C) A less severe example with <5 cells per aggregate exclusively located over the hindbrain. (D-I) Ncad:Gfp injections. Ncad:Gfp localizes to the membranes (arrows) of untreated (D) and BFA-treated control cells (G). In Ovo1 morphant cells, Ncad:Gfp also accumulates in the cytoplasm (E,F; arrowheads), but is largely restored to the membrane in BFA-treated Ovo1 morphant cells (H,I). n, nucleus; ot, otic vesicle. |
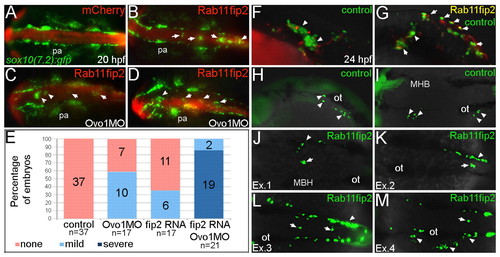
Overexpression of rab11fip2 disrupts NC cell migration and exacerbates the Ovo1 morphant phenotype. (A-E) Rab11fip2 and mCherry mRNAs were injected into sox10:gfp transgenics, in which NC cells fluoresce green in living embryos. Dorsal views, anterior to the left at 24 hpf. (A) Controls injected with mCherry mRNA alone show bilateral sox10:gfp+ cells. (B) By contrast, Gfp-positive cells aggregate in the dorsal midline (arrows) following co-injection of Rab11fip2 and mCherry mRNA. (C,D) Larger aggregates (>5 cells, arrowheads) form over the midbrain in embryos co-injected with subthreshold levels of Rabfip2 mRNA and Ovo1 MO. (E) Quantitation showing proportions of wild-type (red), mild (pale blue; <5 cells per aggregate located over the hindbrain) and severe (dark blue; >5 cells per aggregate located over both the midbrain and hindbrain) NC defects. (F-M) Cell transplantation of rab11fip2 mRNA-injected cells into wild-type hosts. (F,G) Co-transplantation of sox10:gfp, Rab11fip2, mCherry mRNA-injected (green and red) and sox10:gfp uninjected control cells (green) into wild-type hosts; lateral views. Rab11fip2-overexpressing cells remain dorsally located (arrows in G). (H-M) Transplantation of control sox10:gfp+ (H,I) or Rab11fip2 mRNA-injected sox10:gfp+ cells (J-M) into uninjected hosts; lateral view (H), dorsal views (I-M). Many Rab11fip2 overexpressing NC cells remain in the dorsal midline [arrows; examples (Ex) 1-4]. Arrowheads in F-M indicate NC cells that have migrated normally. MHB, mid-hindbrain boundary; ot, otic vesicle; pa, pharyngeal arches. |
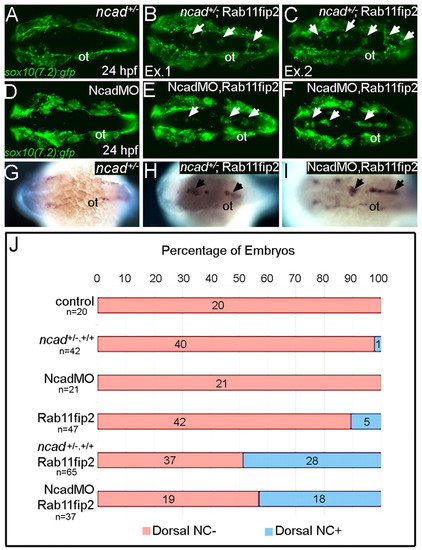
rab11fip2 genetically interacts with ncad to regulate NC migration. (A-F) Live images of tg:sox10(7.2):gfp labeling migratory NC cells in ncad+/- embryos (A-C) and single Ncad morphants (D-F). In contrast to controls (A,D), Gfp-positive NC cells remain in the dorsal neural tube of ncad+/- mutants [B,C; arrows; examples (Ex) 1 and 2] and Ncad morphants (E,F; arrows) injected with subthreshold levels of Rab11fip2 mRNA. (G-I) Similarly, ectopic mitfa-positive cells cluster in the dorsal midline (arrows) of ncad+/- mutants (H) and Ncad morphants (I) overexpressing Rab11fip2, but not in controls (G). (J) Quantitation of genetic interaction studies; numbers of embryos with or without ectopic sox10+ NC clusters in the dorsal midline (blue and red bars, respectively). ot, otic vesicle. |
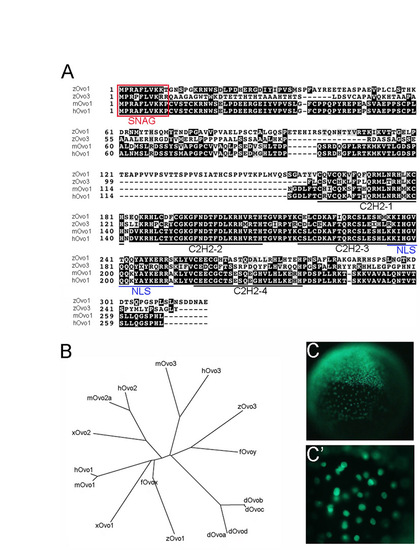
Characterization of zebrafish Ovo orthologs. (A) Alignment of zebrafish Ovo1 and Ovo3 sequences with mouse and human Ovo1. The transcriptional repression SNAG domain is boxed (red). The four C2H2 zinc finger and nuclear localization (NLS) motifs are underlined in black and blue, respectively. (B) Phylogenetic tree of the Ovo family of transcription factors. (C,C′) Nuclear localization of Gfp:Ovo1 following injection into 1-cell-stage zebrafish embryos. |
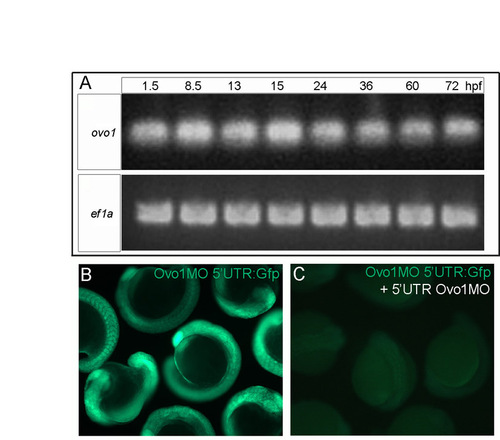
Expression profile of ovo1 and efficacy of Ovo1 MOs. (A) RT-PCR for ovo1 (upper panel) at: 1.5-72 hours post-fertilization (hpf). ef1a (lower panel) is a loading control. (B,C) Live embryos injected with a construct carrying the Ovo1 MO binding site (Ovo1MO 5′UTR) fused to gfp (Ovo1MO 5′UTR:Gfp) showing Gfp expression (B) and loss with co-injection of the 5′UTR Ovo1MO (C). |
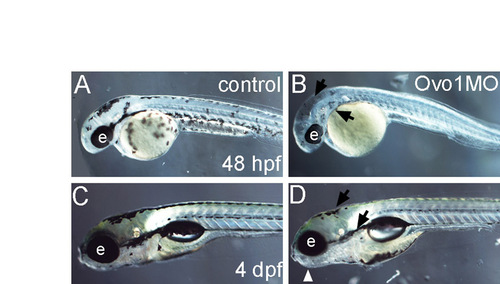
Ovo1 disrupts NC-cell-derived pigment development. (A-D) Live images of control uninjected (A,C) and Ovo1 morphants (B,D) at 48 hpf (A,B) and 4 dpf (C,D). Lateral views, anterior to the left. Melanocytes are reduced in Ovo1 morphants (B,D; arrows). e, eye. |
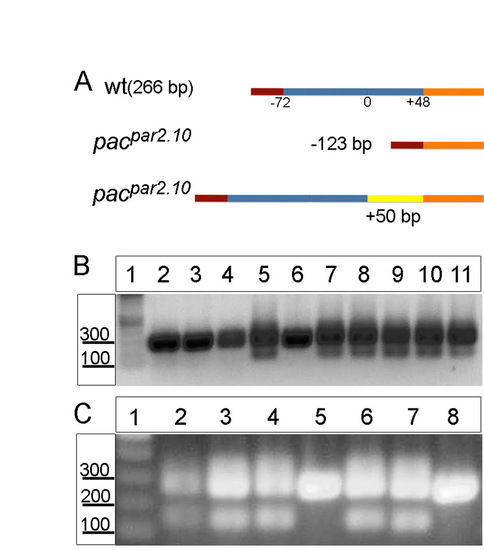
Identification of pacpar2.10 (ncadb>+/b>/b>-) mutants. (A) Schematic of the different ncad mutant isoforms. The wild-type product is 266 bp; mutants contain either a smaller 143 bp form or larger isoforms with as many as 50 additional nucleotides. (B,C) RT-PCR for ncad in pacpar2.10 heterozygous embryos injected with Ovo1 MO (B, all lanes; C, lanes 6-8) or with Rab11fip2 RNA (C, lanes 3-5). All embryos with ectopic dorsal NC cells (B, lanes 7-11; C, lanes 3,4,6,7) are heterozygous for pacpar2.10, whereas embryos whose NC cells migrated normally do not exhibit alternative spliced forms of ncad (B, lanes 2-6; C, lanes 5,8). Uninjected pacpar2.10 heterozygous control (C, lane 2). |
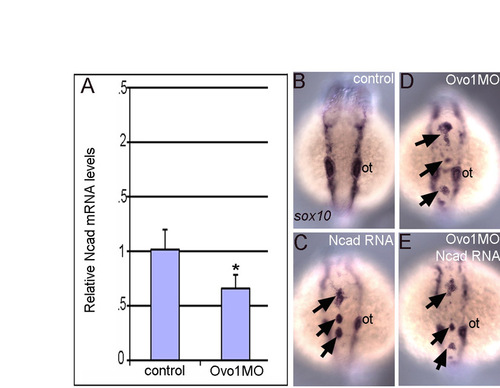
Ncad overexpression does not rescue neural crest defects in Ovo1 morphants. (A) Quantitative PCR shows reduced ncad mRNA levels in Ovo1 morphants (*, P≤0.05). (B-E) In situ hybridization for sox10 in neural crest (NC). Dorsal views, anterior to the top. In contrast to controls (B), NC accumulates (arrows) in the dorsal midline of embryos injected with ncad mRNA (C), Ovo1 morphants (D) or a combination of ncad mRNA and Ovo1 MO (E). ot, otic vesicle. |

Rab11fip2 disrupts the migration of neural crest-derived pigment precursors. Wholemount in situ hybridization for mitfa to label pigment progenitors. These lie lateral to the neural tube in control embryos (A) but cluster over the dorsal midline in embryos overexpressing Rab11fip2 (B,C; arrows). ot, otic vesicle. |

Loss of Rab11fip2 fails to rescue Ovo1 morphants. (A) RT-PCR for rab11fip2 to test morpholino (MO) efficacy (upper panel) using ef1a as a loading control (lower panel). Lanes: 1, control; 2, 0.75 ng Rab11fip2 MO (here referred to as fip2MO); 3, 1.5 ng fip2MO; 4, 3 ng fip2MO; 5, 3 ng Ovo1 MO; 6, 3 ng Ovo1 MO + 0.75 ng fip2MO; 7, 3 ng Ovo1 MO + 1.5 ng fip2MO; 8, 3 ng Ovo1 MO + 3 ng fip2MO. (B) Quantitation of embryos with ectopic NC cells in the dorsal midline (blue) in Ovo1 morphants and Rab11fip2 MO rescued embryos. (C-E) Live images of Gfp expression in NC cells (arrows) in controls (C), Ovo1 single morphants (D) and Ovo1MO, fip2MO double-morphant embryos (E); dorsal views. ot, otic vesicle. |

Cell proliferation, apoptosis and ectodermal specification are unaffected in Ovo1 morphants. (A,B) Wholemount anti-phospho-Histone 3 antibody (PH3) staining at 15 hpf. Dorsal views, anterior to the left. (A2,B2) Insets showing PH3+ mitotic cells in cross-sections through the neural tube of control and Ovo1 morphants at 24 hpf. (C-F) Acridine orange labeling (arrows) reveals elevated apoptosis in Ovo1 morphant embryos compared with controls (C,D), which is eliminated by co-injection of p53 MO (E,F). (G-J) Double in situ hybridization for sox10 in NC and wnt10b in dorsal neural tube. In contrast to controls (G), sox10+ cell aggregates form in the dorsal midline of Ovo1 morphants (H), but not in p53 morphants (I), and injection of p53 MO fails to rescue NC defects in Ovo1 morphants (J). (K,L) Triple in situ hybridization for expression of ap2g in non-neural ectoderm (NNE), hgg1 in prechordal plate mesoderm (PCP) and pax2.1 at the midbrain-hindbrain boundary (MHB) in controls (K) and Ovo1 morphants (L) at 8 hpf. Dorsal views, anterior to the left. Asterisks indicate the borders between the NE and NNE. (M,N) Double labeling for sox10 (red) in NC and krt18 expression in epidermis (dark blue) in control (M) and Ovo1 morphants (N). Dorsal clumps of sox10+ NC cells form in morphants, while epidermis appears unaffected (arrows). e, eye; ot, otic vesicles. |

Unillustrated author statements EXPRESSION / LABELING:
|