FIGURE SUMMARY
Title

Defective Excitatory/Inhibitory Synaptic Balance and Increased Neuron Apoptosis in a Zebrafish Model of Dravet Syndrome

Authors
Brenet, A., Hassan-Abdi, R., Somkhit, J., Yanicostas, C., Soussi-Yanicostas, N.
Source
Full text @ Cells

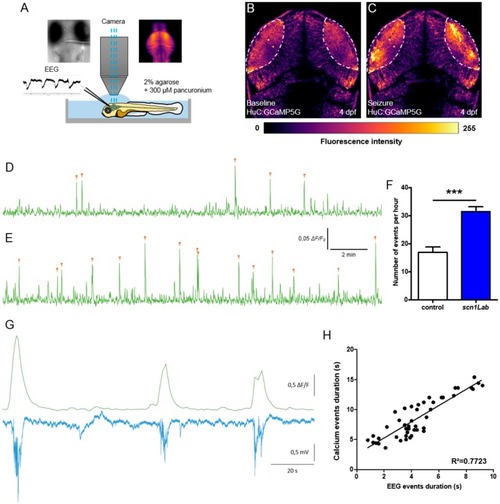
Correlation between LFP and calcium activity in scn1Lab model. (A) Schematic of the experimental setup to simultaneously record local field potential and calcium activity of a larval zebrafish brain. (B,C) Calcium images showing respectively the baseline activity (B) and the seizure activity (C). The fluorescence intensity is color-coded as shown in the color bar below the images. (D,E) Representative 20 min calcium recording of immobilized and paralyzed 4 dpf control (D) (N = 9) and scn1Lab (E) (N = 9) larvae. Each calcium event is shown with an orange arrowhead. (F) Number of events, calcium increases greater that 0.04 ΔF/F0 amplitude, during 1 h recording. (G) Representative LFP, recorded in the left neuropil of the optic tectum, and calcium traces, from the optic tectum, of a paralyzed and immobilized 4 dpf scn1Lab larva. (H) Correlation between LFP and calcium events duration (n = 46). N = number of larvae and n = number of events. Error bars on all graphs represent standard error of the mean (SEM). ***, p < 0.001. p-value was determined using Student’s unpaired t-test.

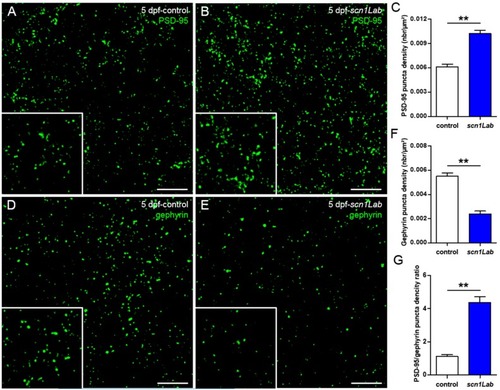
Defects of excitatory/inhibitory balance in the Scn1Lab-depleted larvae. (A,B) 20 µm coronal sections of 5 dpf control (A) (N = 5, n = 15) and scn1Lab (B) (N = 5, n = 15) larvae stained with PSD-95, an excitatory post-synaptic scaffolding protein. (D,E) 20 µm coronal sections of 5 dpf control (D) (N = 5, n = 20) and scn1Lab (E) (N = 5, n = 19) larvae stained with gephyrin, an inhibitory post-synaptic scaffolding protein. Images were acquired with a SP8 Leica laser scanning confocal microscope equipped with a 40x/oil 1.3 objective. Scale bar 5 µm. (C,F) Quantification of PSD-95 (C) and gephyrin (F) puncta density. (G) PSD-95/gephyrin puncta density ratio. N = number of larvae and n = number of sections. Error bars on all graphs represent standard error mean (SEM). **, p < 0.01. p-values were determined using the Mann-Whitney test.

EXPRESSION / LABELING:
Antibodies:
Fish:
Knockdown Reagent:
Anatomical Term:
Stage: Day 5
PHENOTYPE:
Fish:
Knockdown Reagent:
Observed In:
Stage: Day 5

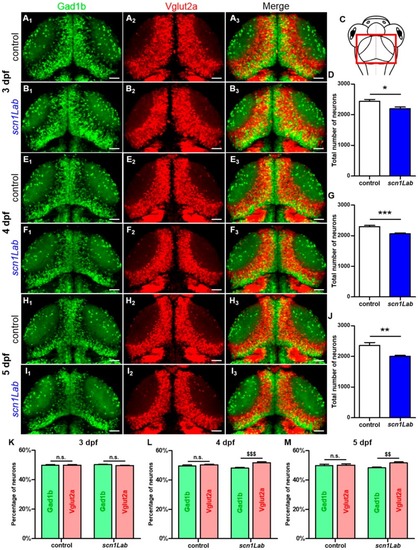
Evolution of the excitatory-inhibitory neuronal population in the scn1Lab model. (A1-3,B1-3) Dorsal view of 3 dpf Tg[Gad1b:GFP; Vglut2a:DsRed] control (A1-3) (N = 8) and scn1Lab (B1-3) (N = 8) living larvae. (A1,B1) Inhibitory neurons (Gad1b:GFP) in 3 dpf control (A1) and scn1Lab (B1) larvae. (A2,B2) Excitatory neurons (Vglut2a:DsRed) in 3 dpf control (A2) and scn1Lab (B2) larvae. (A3,B3) Merged image of 3 dpf control (A3) and scn1Lab (B3) larvae. (C) Dorsal view schematic of a 4 dpf larva. The red rectangle shows the region of interest. (E1-3,F1-3) Dorsal view of 4 dpf Tg[Gad1b:GFP; Vglut2a:DsRed] control (E1-3) (N = 8) and scn1Lab (F1-3) (N = 8) living larvae. (E1,F1) Inhibitory neurons (Gad1b:GFP) in 4 dpf control (E1) and scn1Lab (F1) larvae. (E2,F2) Excitatory neurons (Vglut2a:DsRed) in 4 dpf control (E2) and scn1Lab (F2) larvae. (E3,F3) Merged image of 4 dpf control (E3) and scn1Lab (F3) larvae. (H1-3,I1-3) Dorsal view of 5 dpf Tg[Gad1b:GFP; Vglut2a:DsRed] control (H1-3) (N = 8) and scn1Lab (I1-3) (N = 8) living larvae. (H1,I1) Inhibitory neurons (Gad1b:GFP) in 5 dpf control (H1) and scn1Lab (I1) larvae. (H2,I2) Excitatory neurons (Vglut2a:DsRed) in 5 dpf control (H2) and scn1Lab (I2) larvae. (H3,I3) Merged image of 5 dpf control (H3) and scn1Lab (I3) larvae. (D,G,J) Number of neurons in control and scn1Lab larvae at 3 dpf (D), 4 dpf (G) and 5 dpf (J). (K,L,M) Number of inhibitory and excitatory neurons in control and scn1Lab larvae at 3 dpf (K), 4 dpf (L) and 5 dpf (M). All images are representative 20 µm stacks acquired using LSM 880 Zeiss laser scanning confocal microscope equipped with a WPApo 20x/1.0 objective. Scale bar 40 µm. N = number of embryos. Error bars on all graphs represent standard error mean (SEM). * p < 0.05; ** p < 0.01; ***,p < 0.001 indicate a statistically significant difference between control and scn1Lab larvae. Statistically significant difference between inhibitory and excitatory neuronal population is indicated as $$, p < 0.01; $$$, p < 0.001. p-values were determined using Student’s unpaired t-test.

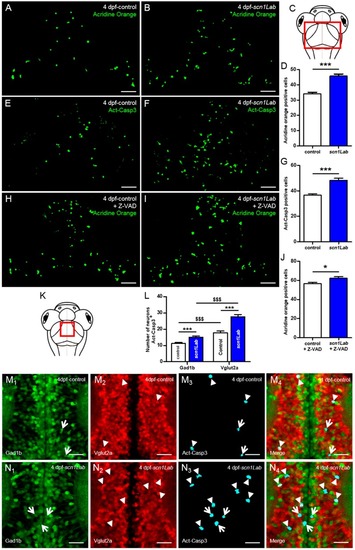
Increased neuronal death in Scn1Lab-depleted larvae. (A,B) Dorsal view of 4 dpf living control (A) (N = 15) and scn1Lab (B) (N = 15) larvae stained with acridine orange; 100 µm stack. Scale bar 40 µm. (C) Dorsal view schematic of 4 dpf larva. The red rectangle shows the region of interest for global cell death quantification. (D) Number of acridine orange-positive cells in 4 dpf brain. (E,F) Dorsal view of 4 dpf control (E) (N = 24) and scn1Lab (F) (N = 22) brain stained with activated caspase-3 antibody; 100 µm stack. Scale bar 40 µm. (G) Number of activated caspase-3-positive cells in 4 dpf brain. (H-I) Dorsal view of 4 dpf Z-VAD-treated control (H) (N = 18) and scn1Lab (I) (N = 16) larvae stained with acridine orange; 100 µm stack. Scale bar 40 µm. (J) Number of acridine orange-positive cells in 4 dpf brain. (K) Dorsal view schematic of 4 dpf larva. The red rectangle shows the region of interest for activated caspase-3 signal colocalization with inhibitory and excitatory neurons quantification. (L) Number of inhibitory (Gad1b:GFP) and excitatory (Vglut2a:DsRed) neurons also showing activated caspase-3 labelling in control and scn1Lab larvae. (M1-4, N1-4) Dorsal view of 4 dpf Tg[Gad1b:GFP; Vglut2a:DsRed] control (M1-4) (N = 14) and scn1Lab (N1-4) (N = 14) brain stained with activated caspase-3 antibody; representative 15 µm stack. Scale bar 10 µm. (M1,N1) Inhibitory neurons (Gad1b:GFP) in control (M1) and scn1Lab (N1) larvae. (M2,N2) Excitatory neurons (Vglut2a:DsRed) in control (M2) and scn1Lab (N2) larvae. (M3,N3) Activated caspase-3 staining in control (M3) and scn1Lab (N3) larvae. (M4,N4) Merged images of control (M4) and scn1Lab (N4) larvae. Excitatory neurons with activated caspase-3 expression are shown by arrowheads, while inhibitory neurons with activated caspase-3 expression are shown by arrows. Images were all acquired with an SP8 Leica laser scanning confocal microscope equipped with 40x/water 1.1 objective. N = number of embryos. Error bars on all graphs represent standard error mean (SEM). *, p < 0.05; ***, p < 0.001 indicate a statistically significant difference between control and scn1Lab larvae. A statistically significant difference between inhibitory and excitatory neuronal population is indicated as $$$, p < 0.001. p-values were determined using Student’s unpaired t-test.

Acknowledgments
This image is the copyrighted work of the attributed author or publisher, and ZFIN has permission only to display this image to its users. Additional permissions should be obtained from the applicable author or publisher of the image. Full text @ Cells