
Figure 3
- ID
- ZDB-IMAGE-191230-1705
- Genes
- Publication
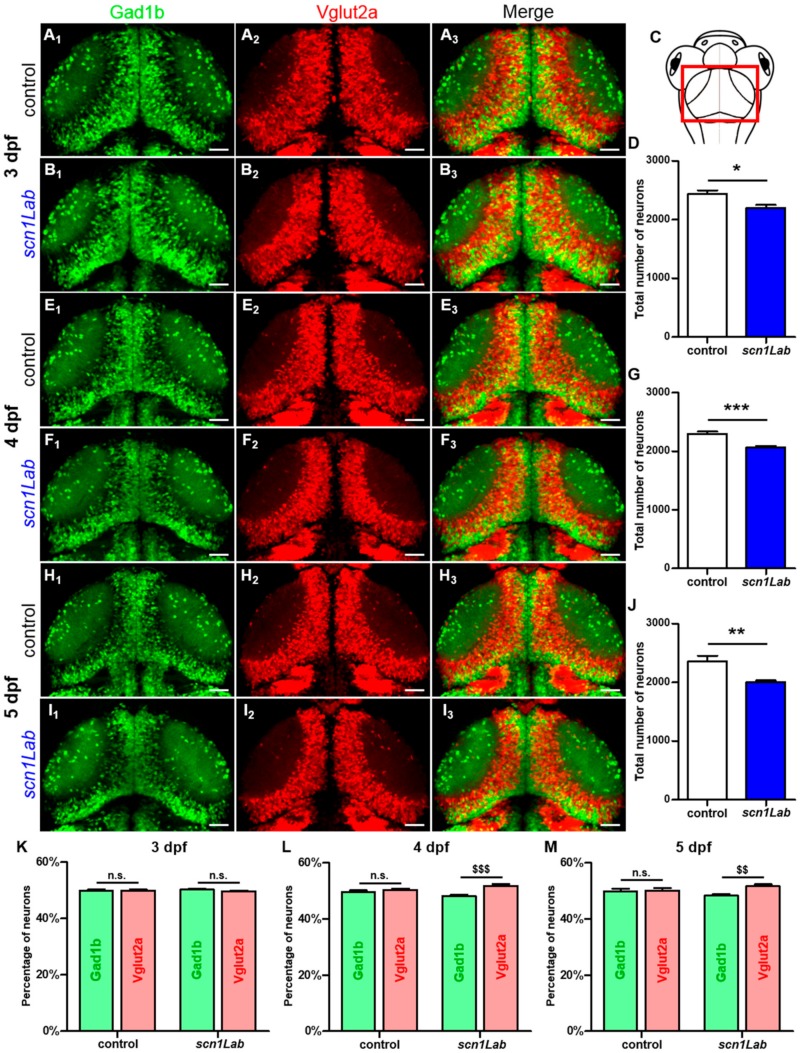
- Brenet et al., 2019 - Defective Excitatory/Inhibitory Synaptic Balance and Increased Neuron Apoptosis in a Zebrafish Model of Dravet Syndrome
- All Figures
- Figures for Brenet et al., 2019
|
Figure 3
Evolution of the excitatory-inhibitory neuronal population in the