IMAGE

Figure 4

ID
ZDB-IMAGE-191230-1707
Source
Figures for Brenet et al., 2019
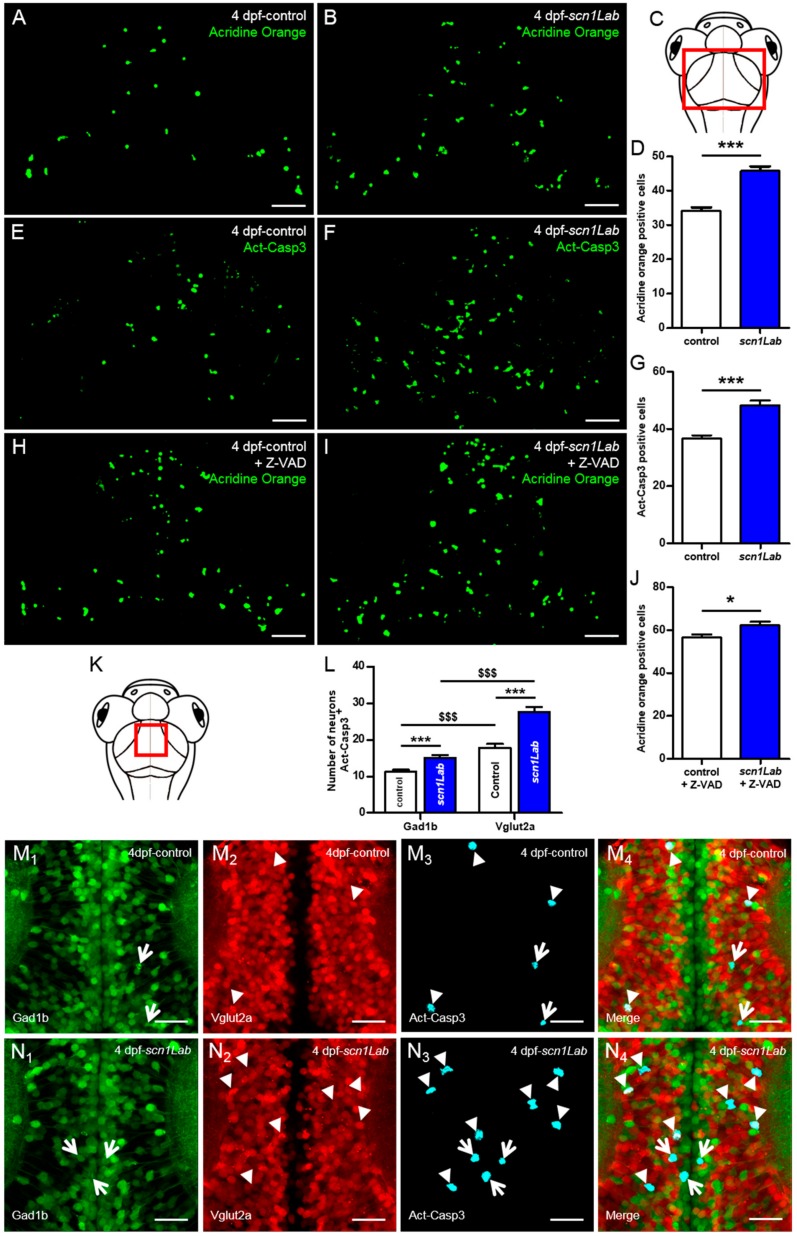
Image
Figure Caption

Figure 4

Increased neuronal death in Scn1Lab-depleted larvae. (A,B) Dorsal view of 4 dpf living control (A) (N = 15) and scn1Lab (B) (N = 15) larvae stained with acridine orange; 100 µm stack. Scale bar 40 µm. (C) Dorsal view schematic of 4 dpf larva. The red rectangle shows the region of interest for global cell death quantification. (D) Number of acridine orange-positive cells in 4 dpf brain. (E,F) Dorsal view of 4 dpf control (E) (N = 24) and scn1Lab (F) (N = 22) brain stained with activated caspase-3 antibody; 100 µm stack. Scale bar 40 µm. (G) Number of activated caspase-3-positive cells in 4 dpf brain. (H-I) Dorsal view of 4 dpf Z-VAD-treated control (H) (N = 18) and scn1Lab (I) (N = 16) larvae stained with acridine orange; 100 µm stack. Scale bar 40 µm. (J) Number of acridine orange-positive cells in 4 dpf brain. (K) Dorsal view schematic of 4 dpf larva. The red rectangle shows the region of interest for activated caspase-3 signal colocalization with inhibitory and excitatory neurons quantification. (L) Number of inhibitory (Gad1b:GFP) and excitatory (Vglut2a:DsRed) neurons also showing activated caspase-3 labelling in control and scn1Lab larvae. (M1-4, N1-4) Dorsal view of 4 dpf Tg[Gad1b:GFP; Vglut2a:DsRed] control (M1-4) (N = 14) and scn1Lab (N1-4) (N = 14) brain stained with activated caspase-3 antibody; representative 15 µm stack. Scale bar 10 µm. (M1,N1) Inhibitory neurons (Gad1b:GFP) in control (M1) and scn1Lab (N1) larvae. (M2,N2) Excitatory neurons (Vglut2a:DsRed) in control (M2) and scn1Lab (N2) larvae. (M3,N3) Activated caspase-3 staining in control (M3) and scn1Lab (N3) larvae. (M4,N4) Merged images of control (M4) and scn1Lab (N4) larvae. Excitatory neurons with activated caspase-3 expression are shown by arrowheads, while inhibitory neurons with activated caspase-3 expression are shown by arrows. Images were all acquired with an SP8 Leica laser scanning confocal microscope equipped with 40x/water 1.1 objective. N = number of embryos. Error bars on all graphs represent standard error mean (SEM). *, p < 0.05; ***, p < 0.001 indicate a statistically significant difference between control and scn1Lab larvae. A statistically significant difference between inhibitory and excitatory neuronal population is indicated as $$$, p < 0.001. p-values were determined using Student’s unpaired t-test.

Figure Data
Acknowledgments
This image is the copyrighted work of the attributed author or publisher, and ZFIN has permission only to display this image to its users. Additional permissions should be obtained from the applicable author or publisher of the image. Full text @ Cells