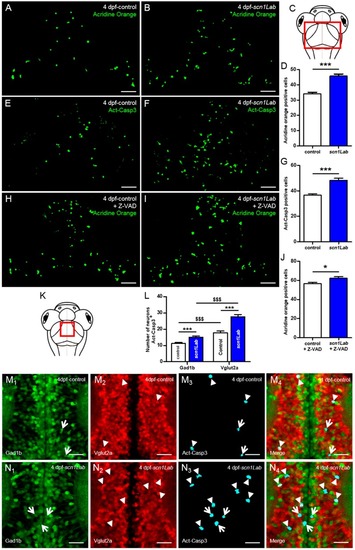
Increased neuronal death in Scn1Lab-depleted larvae. (A,B) Dorsal view of 4 dpf living control (A) (N = 15) and scn1Lab (B) (N = 15) larvae stained with acridine orange; 100 µm stack. Scale bar 40 µm. (C) Dorsal view schematic of 4 dpf larva. The red rectangle shows the region of interest for global cell death quantification. (D) Number of acridine orange-positive cells in 4 dpf brain. (E,F) Dorsal view of 4 dpf control (E) (N = 24) and scn1Lab (F) (N = 22) brain stained with activated caspase-3 antibody; 100 µm stack. Scale bar 40 µm. (G) Number of activated caspase-3-positive cells in 4 dpf brain. (H-I) Dorsal view of 4 dpf Z-VAD-treated control (H) (N = 18) and scn1Lab (I) (N = 16) larvae stained with acridine orange; 100 µm stack. Scale bar 40 µm. (J) Number of acridine orange-positive cells in 4 dpf brain. (K) Dorsal view schematic of 4 dpf larva. The red rectangle shows the region of interest for activated caspase-3 signal colocalization with inhibitory and excitatory neurons quantification. (L) Number of inhibitory (Gad1b:GFP) and excitatory (Vglut2a:DsRed) neurons also showing activated caspase-3 labelling in control and scn1Lab larvae. (M1-4, N1-4) Dorsal view of 4 dpf Tg[Gad1b:GFP; Vglut2a:DsRed] control (M1-4) (N = 14) and scn1Lab (N1-4) (N = 14) brain stained with activated caspase-3 antibody; representative 15 µm stack. Scale bar 10 µm. (M1,N1) Inhibitory neurons (Gad1b:GFP) in control (M1) and scn1Lab (N1) larvae. (M2,N2) Excitatory neurons (Vglut2a:DsRed) in control (M2) and scn1Lab (N2) larvae. (M3,N3) Activated caspase-3 staining in control (M3) and scn1Lab (N3) larvae. (M4,N4) Merged images of control (M4) and scn1Lab (N4) larvae. Excitatory neurons with activated caspase-3 expression are shown by arrowheads, while inhibitory neurons with activated caspase-3 expression are shown by arrows. Images were all acquired with an SP8 Leica laser scanning confocal microscope equipped with 40x/water 1.1 objective. N = number of embryos. Error bars on all graphs represent standard error mean (SEM). *, p < 0.05; ***, p < 0.001 indicate a statistically significant difference between control and scn1Lab larvae. A statistically significant difference between inhibitory and excitatory neuronal population is indicated as $$$, p < 0.001. p-values were determined using Student’s unpaired t-test.
|
