
- Title
-
Common and specific downstream signaling targets controlled by Tlr2 and Tlr5 innate immune signaling in zebrafish
- Authors
- Yang, S., Marín-Juez, R., Meijer, A.H., Spaink, H.P.
- Source
- Full text @ BMC Genomics
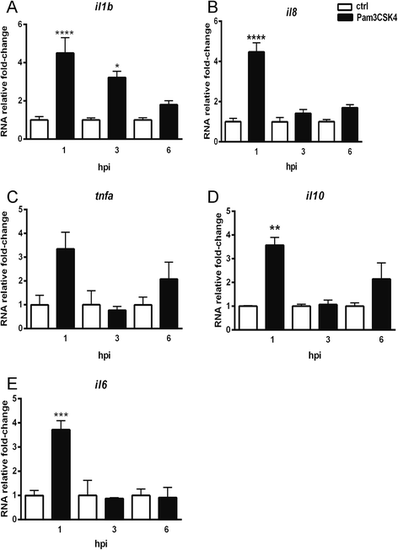
Immune genes expression at different time points upon Pam3CSK4 stimulation. Embryos were injected at 27 hpf with 1 ng Pam3CSK4 and expression levels of il1b (a), il8 (b), tnfa (c), il10 (d) and il6 (e) were determined at 1, 3 and 6 hpi by qPCR. Data (mean ± SEM) are combined from at least three biological replicates (n = 15 embryos per group) and expressed relative to their corresponding mock injection (water) control, which is set at 1. Statistical significance of differences between mock and Pam3CSK4 groups was determined by ANOVA analysis and Tukey’s multiple comparisons test, *p < 0.05, **p < 0.01, ***p < 0.001 |
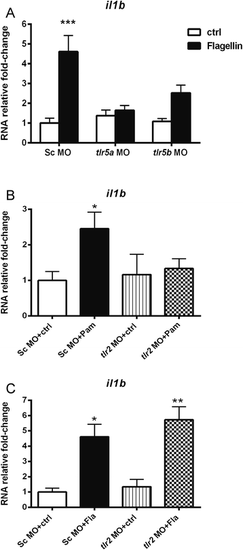
il1b expression in tlr2 and tlr5 morphants following PAMPs stimulation. Embryos were injected at the 1-2 cells stage with standard control (Sc), tlr2, tlr5a or tlr5b morpholino (MO) and subsequently injected with Pam3CSK4 at 27 hpf, flagellin or water as a mock control. Expression of il1b was determined by qPCR at 1 hpi. a tlr5a and tlr5b knockdown effect on il1b RNA expression in response to flagellin. b C tlr2 knockdown effect on il1b RNA expression in response to Pam3CSK4 (b) or flagellin (c). Data (mean ± SEM) are combined from at least three biological replicates (n = 10 embryos per group) and expressed relative to their corresponding water control, which is set at 1. Statistical significance was determined by ANOVA analysis and Tukey’s multiple comparisons test, *p < 0.05, **p < 0.01, ***p < 0.001; Pam, Pam3CSK4 injecton; Fla, flagellin injection |
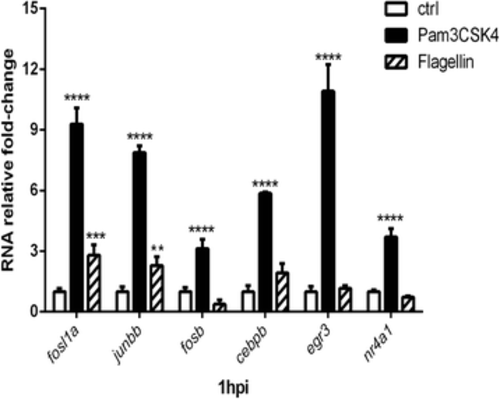
qPCR analysis of transcription factors genes responsive to PAMPs stimulation. Expression levels of fosl1a, fosb, junbb, cebpeb, egr3 and nr4a1 following Pam3CSK4 and flagellin stimulation are determined by qPCR. Data (mean ± SD) are combined from at least tree biological replicates (n = 15 embryos per group) and expressed relative to their corresponding water control, which is set at 1. Statistical significance was determined by two-way ANOVA analysis and Tukey’s multiple comparisons test, *p < 0.05, **p < 0.01, ***p < 0.001, ****p < 0.0001 |