- Title
-
Functional characterization of lmo2-Cre transgenic zebrafish
- Authors
- Wang, L., Zhang, Y., Zhou, T., Fu, Y.F., Du, T.T., Jin, Y., Chen, Y., Ren, C.G., Peng, X.L., Deng, M., and Liu, T.X.
- Source
- Full text @ Dev. Dyn.
|
Screen for Tg(zlmo2:Cre) F0 founders. A: Schematic representation of the lmo2-Cre construct. The Cre gene was fused to a 2.5-kb lmo2 promoter. pA denotes SV40 poly A element. Arrows denote the position of primers used for genomic PCR screening. B: The representative results of genomic PCR screen for Tg(zlmo2:Cre) F0 founder pairs. C: The actin-LDL-EGFP reporter plasmid used to test the Cre activity in the embryos of the Tg(zlmo2:Cre) F0 founder. The Cre activation will result in the excision of DsRed with the simultaneous initiation of EGFP expression. D: Red (top) and green (middle) fluorescence observed in embryo injected with the reporter plasmid at 36 hpf. Circulating blood cells expressing both DsRed and EGFP can also be seen (arrows). Embryos are lateral views with heads to the left. |
|
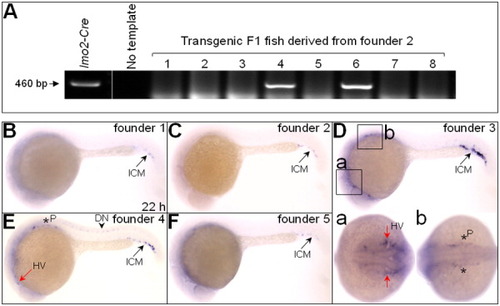
Comparisons of Cre expression patterns in the F2 generation embryos derived from each of the five F1 Tg(zlmo2:Cre) transgenic lines. A: Representative of genomic PCR screen for F1 Tg(zlmo2:Cre) transgenic adults. B-F: Cre expression patterns in the F2 generation embryos derived from each of the five F1 Tg(zlmo2:Cre) transgenic lines at 22 hpf. Cre expression is detected at head vasculature (HV, red arrows), pronephic primordial (P, stars), posterior ICM (black arrows), and dorsal neurons (DN, black arrowheads). Amplified views of Cre expression at head vasculature (a, ventral view) and pronephic primordial (b, dorsal view) are shown in D. B,C,E,F,D (top) are lateral views with heads to the left. EXPRESSION / LABELING:
|
|
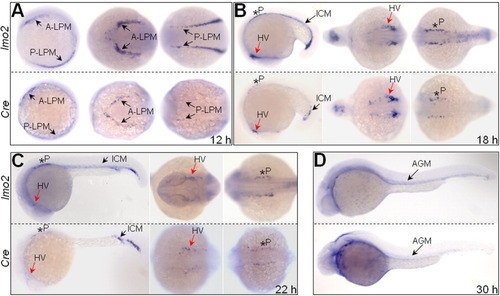
Spatial-temporal expression of Cre mRNAs recapitulates endogenous lmo2 expression. In each panel, lmo2 expression is shown at the top and Cre expression at the bottom. A: At 12 hpf, expression of lmo2 and Cre is firstly detected at A-LPM and P-LPM (arrows). B,C: lmo2 and Cre expression are detected at head vasculature (HV, red arrows), pronephic primordial (P, stars), and ICM (black arrows) at 18 (B) and 22 hpf (C). Embryos in the left, middle, and right are lateral, ventral, and dorsal views, respectively. D: lmo2 and Cre expression are weakly detected at the presumptive AGM (arrows, lateral view). All embryos are shown with heads to the left. EXPRESSION / LABELING:
|
|
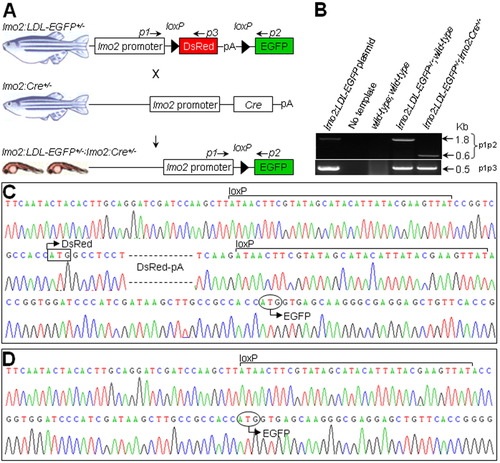
Molecular evidences of Cre-mediated recombination. A: Schematic representation of Tg(zlmo2:loxP-DsRed-loxP-EGFP) and Tg(zlmo2:Cre) transgenic lines used to test Cre activity. In the presence of Cre expression, DsRed is excised and expression of EGFP is initiated in double transgenic embryos. Arrows denote the positions of primers designed to detect genomic recombination by PCR. B: Detection of Cre-mediated recombination by genomic PCR. An expected 0.6-kb recombinant fragment is amplified after Cre-mediated excision using primer p1 and p2. A 0.5-kb unrecombinant fragment was also amplified using primer p1 and p3 (arrows). C,D: Sequence of the unrecombined 1.8-kb product (C) and recombined 0.6-kb product (D). Shown are sequences from around 30 bp upstream of the first loxP site to around 30 bp downstream of the ATG start codon of EGFP (circle). Dashed line between the loxP sites denotes the open reading frame of DsRed; black boxes denote the ATG start codon of DsRed; and black lines indicate the loxP sites. |
|
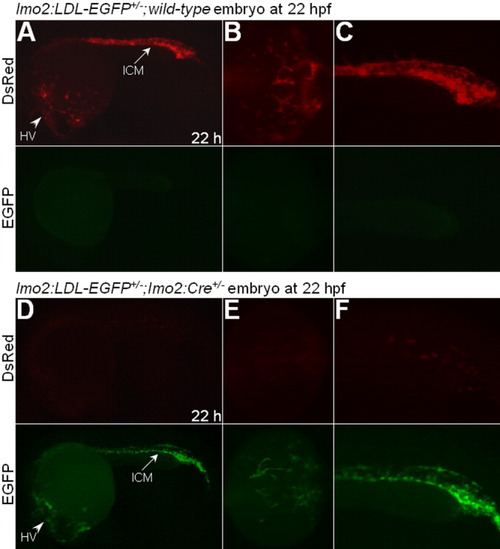
Spatial-temporal Cre activity of Tg(zlmo2:Cre) transgenic line. A-C: The lmo2:LDL-EGFP+/-;wild-type embryo at 22 hpf. Expression of DsRed in the head vasculature (HV, arrowhead) and ICM (arrow) in A; an amplified ventral view of head vasculature in B; and an amplified lateral view of ICM in C. D-F: The lmo2:LDL-EGFP+/-;lmo2:Cre+/- double transgenic embryo at 22 hpf. Initiation of EGFP expression in the head vasculature (HV, arrowhead) and ICM (arrow) with residual expression of DsRed detected. Lateral views in A,C,D,F. All embryos are shown with heads to left. |
|
Cre-mediated recombination occurred specifically in lmo2-positive cells. The lmo2:LDL-EGFP+/-;lmo2:Cre+/- double transgenic embryos at 22 hpf were subject to two-color WISH using an antibody against EGFP with either a dig-labeled lmo2 or dig-labeled Cre antisense mRNA as a probe. A: lmo2 transcripts (top) and EGFP proteins (middle) are co-localized (bottom) in the ICM (arrows). B: Cre transcripts (top) and EGFP proteins (middle) are co-localized (bottom) in the ICM (arrows). All the embryos are lateral views with heads to the left. |
|
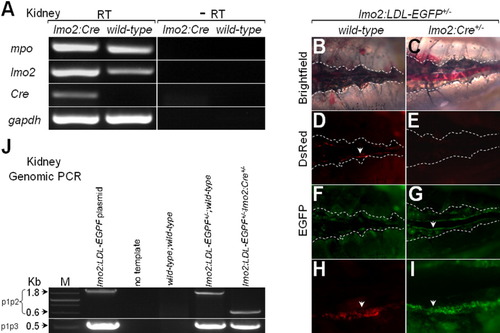
Cre expression and activity in the kidney marrow of Tg(zlmo2:Cre) adult zebrafish. A: Detection of Cre expression by semi-quantitative RT-PCR. B-I: Cre activity in kidney marrow. The morphology of kidney marrows derived from lmo2:LDL-EGFP+/-;wild-type and lmo2:LDL-EGFP+/-;lmo2:Cre+/- fish is shown in B and C (dotted lines, head to the left). Detection of fluorescence in the kidney marrow of lmo2:LDL-EGFP+/-;wild-type (D and F), and lmo2:LDL-EGFP+/-;lmo2:Cre+/- fish (E and G). Amplified views of regions expressing red fluorescence (H) and green fluorescence (I), as shown in D and G, respectively. J: Detection of Cre-mediated recombination by genomic PCR in kidney marrow. Genomic PCR was performed using the same primer sets as shown in Figure 4A. The 0.6-kb recombinant fragment was amplified only from the kidney marrow of lmo2:LDL-EGFP+/-;lmo2:Cre+/- fish. |
|
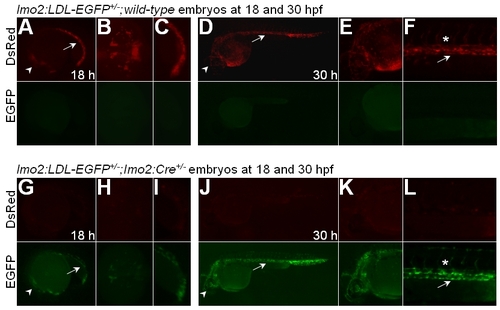
Spatial-temporal Cre activity of Tg(zlmo2:Cre) transgenic line. A-C: The lmo2:LDL-EGFP+/-;wild-type embryo at 18 hpf. Expression of DsRed in the head vasculature (arrowhead) and ICM (arrow) in A; an amplified ventral view of head vasculature in B; and an amplified lateral view of ICM in C. D-F: The lmo2:LDL-EGFP+/-;wild-type embryo at 30 hpf. Expression of DsRed in the vessels in D (arrowhead and arrow); an amplified view of head vasculature in E; and an amplified lateral view of trunk vessels (arrow) and ISVs (star) in F. G-I: The lmo2:LDL-EGFP+/-;lmo2:Cre+/- double transgenic embryo at 18 hpf. Initiation of EGFP expression in the head vasculature and ICM with residual expression of DsRed fluorescence detected. J-L: The lmo2:LDL-EGFP+/-;lmo2:Cre+/- double transgenic embryo at 30 hpf. Initiation of EGFP expression in the vessels with residual expression of DsRed fluorescence detected. Lateral views in A,C,D-G, and I-L. All embryos are shown with heads to the left. EXPRESSION / LABELING:
|
|
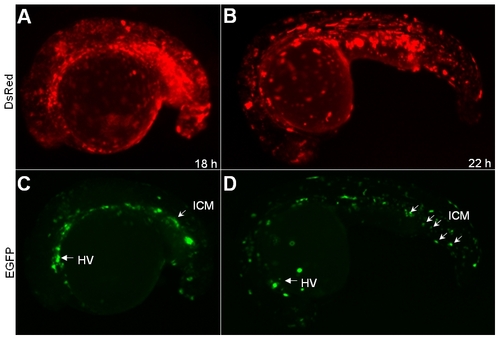
Evidence of the specificity of Cre activity in Tg(zlmo2:Cre) transgenic line. beta-actin-loxP-DsRed-loxP-EGFP reporter plasmid was injected into the Tg(zlmo2:Cre) embryos. A,B: Relatively ubiquitous expression of DsRed at 18 hpf and 22 hpf. C,D: Expression of EGFP in the head vasculature and ICM at 18 hpf and 22 hpf (arrows). All embryos are shown with heads to the left. |


