
FIGURE
Fig. 5
Fig. 5
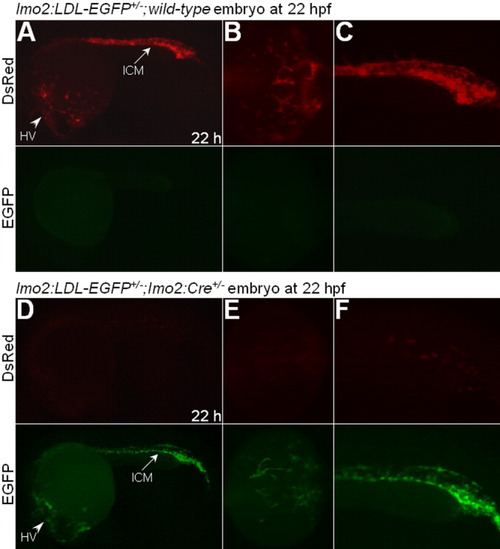
Spatial-temporal Cre activity of Tg(zlmo2:Cre) transgenic line. A-C: The lmo2:LDL-EGFP+/-;wild-type embryo at 22 hpf. Expression of DsRed in the head vasculature (HV, arrowhead) and ICM (arrow) in A; an amplified ventral view of head vasculature in B; and an amplified lateral view of ICM in C. D-F: The lmo2:LDL-EGFP+/-;lmo2:Cre+/- double transgenic embryo at 22 hpf. Initiation of EGFP expression in the head vasculature (HV, arrowhead) and ICM (arrow) with residual expression of DsRed detected. Lateral views in A,C,D,F. All embryos are shown with heads to left. |
Expression Data
Expression Detail
Antibody Labeling
Phenotype Data
Phenotype Detail
Acknowledgments
This image is the copyrighted work of the attributed author or publisher, and
ZFIN has permission only to display this image to its users.
Additional permissions should be obtained from the applicable author or publisher of the image.
Full text @ Dev. Dyn.