
Fig. 2
- ID
- ZDB-IMAGE-080829-1
- Genes
- Publication
- Wang et al., 2008 - Functional characterization of lmo2-Cre transgenic zebrafish
- All Figures
- Figures for Wang et al., 2008
|
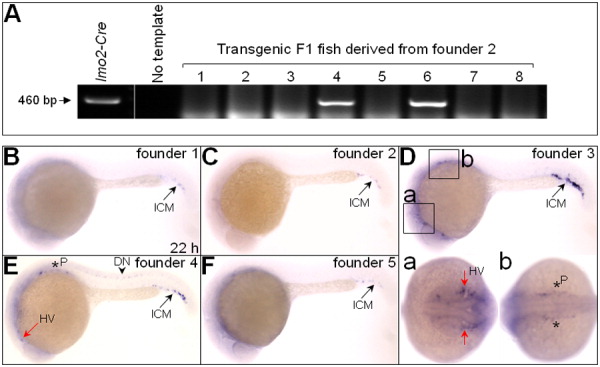
Fig. 2 Comparisons of Cre expression patterns in the F2 generation embryos derived from each of the five F1 Tg(zlmo2:Cre) transgenic lines. A: Representative of genomic PCR screen for F1 Tg(zlmo2:Cre) transgenic adults. B-F: Cre expression patterns in the F2 generation embryos derived from each of the five F1 Tg(zlmo2:Cre) transgenic lines at 22 hpf. Cre expression is detected at head vasculature (HV, red arrows), pronephic primordial (P, stars), posterior ICM (black arrows), and dorsal neurons (DN, black arrowheads). Amplified views of Cre expression at head vasculature (a, ventral view) and pronephic primordial (b, dorsal view) are shown in D. B,C,E,F,D (top) are lateral views with heads to the left.