
Fig. S1
- ID
- ZDB-IMAGE-080829-7
- Genes
- Publication
- Wang et al., 2008 - Functional characterization of lmo2-Cre transgenic zebrafish
- All Figures
- Figures for Wang et al., 2008
|
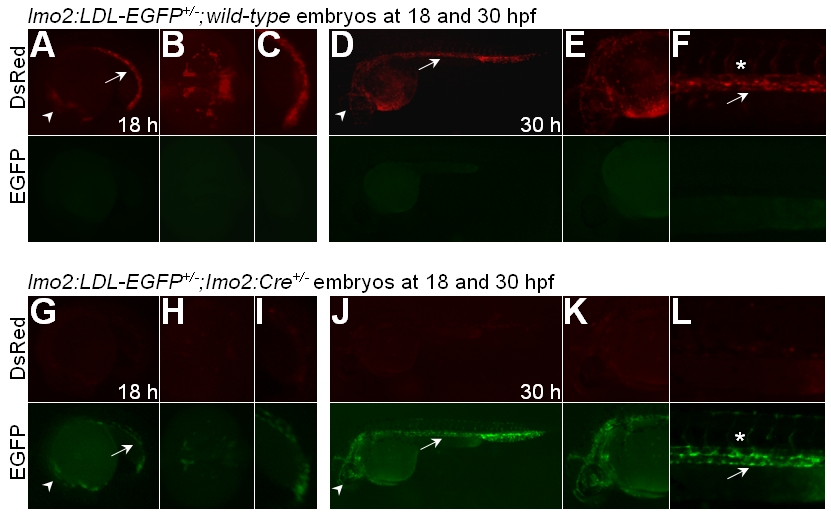
Fig. S1 Spatial-temporal Cre activity of Tg(zlmo2:Cre) transgenic line. A-C: The lmo2:LDL-EGFP+/-;wild-type embryo at 18 hpf. Expression of DsRed in the head vasculature (arrowhead) and ICM (arrow) in A; an amplified ventral view of head vasculature in B; and an amplified lateral view of ICM in C. D-F: The lmo2:LDL-EGFP+/-;wild-type embryo at 30 hpf. Expression of DsRed in the vessels in D (arrowhead and arrow); an amplified view of head vasculature in E; and an amplified lateral view of trunk vessels (arrow) and ISVs (star) in F. G-I: The lmo2:LDL-EGFP+/-;lmo2:Cre+/- double transgenic embryo at 18 hpf. Initiation of EGFP expression in the head vasculature and ICM with residual expression of DsRed fluorescence detected. J-L: The lmo2:LDL-EGFP+/-;lmo2:Cre+/- double transgenic embryo at 30 hpf. Initiation of EGFP expression in the vessels with residual expression of DsRed fluorescence detected. Lateral views in A,C,D-G, and I-L. All embryos are shown with heads to the left.