- Title
-
Analysis of origin and growth of the thyroid gland in zebrafish
- Authors
- Alt, B., Reibe, S., Feitosa, N.M., Elsalini, O.A., Wendl, T., and Rohr, K.B.
- Source
- Full text @ Dev. Dyn.
|
Differentiation markers start to be expressed in the thyroid primordium during embryonic development in zebrafish. A: Simplified sketch depicting the physiological activity of a vertebrate thyroid follicle cell (blue, nucleus light blue). The red arrow indicates that Ctsb is also required for human thyroglobulin (TG) degradation after endocytosis. Note that the gene slc5a5 encodes the sodium/iodide symporter NIS. For further details, see text. B-K: Expression of thyroid markers in zebrafish embryos. Whole-mounts (B-G) and sections (H-K); lateral views (B,C,F,G) and ventral views (D,E), anterior always to the left. The stage is shown bottom right, the probe/staining bottom left. B-I: Wild-type embryos; J,K: cross-sections of noitu29 homozygous embryos. Arrows point to the thyroid primordium, asterisks mark pharyngeal mesenchyme, and arrowheads expression of ctsb in the yolk syncytial layer. hy, hypothalamus; J-, iodide; TPO, thyroperoxidase. |
|
Thyroglobulin (TG) immunostaining labels the apical and some lateral membranes of thyroid follicle cells. Ventral views (A-D,H-J), anterior always to the left, and cross-sections (E-G). Stage and probe/staining are indicated as in Figure 1. A-D: TG immunostaining labels thyroid follicles from approximately 55 hours postfertilization (hpf). The ceratohyal cartilage (the ventral portion of the hyoid arch) and the heart (out of focus) are highlighted by dotted lines. E-G: In situ hybridization combined with TG immunostaining. At 55 hpf, immunostaining labels clearly only the lumen of a first follicle when combined with nk2.1a (E). Later, the follicle has grown (E and F show same magnification). F: ctsb is not exclusively expressed in thyroid follicle cells, but also in subepidermal cells (arrowheads) and in pharyngeal mesenchyme. G: slc5a5 and tg are exclusively expressed in the cytoplasm of follicle cells (tg staining is identical to slc5a5, not shown). H: Close-up of T4 immunostaining, showing follicle cells (arrows) around the follicle lumen in Nomarski optics, same magnification as in G. I,J: In lia mutants, a row of distinct follicles is visualized with T4 immunostaining. In the strongly affected pharynx, most cartilaginous structures are missing. The dotted line in I demarcates the ceratohyal cartilage that is still present in this mutant (Herzog et al.,[2004a]). Note that the overall length of the pharyngeal area is reduced. In a wild-type sibling, the ceratohyal cartilage is marked for comparison (J, dotted line). h, heart; ch, ceratohyal. |
|
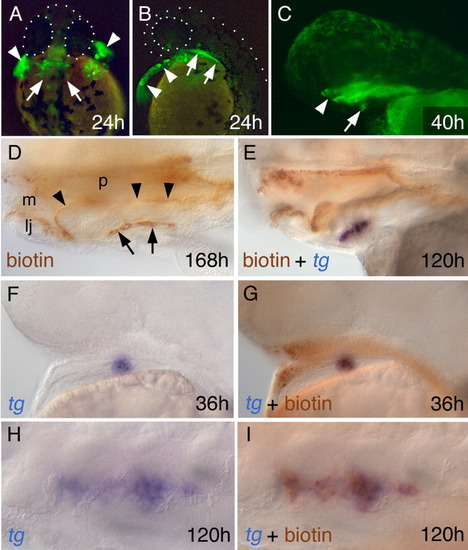
Tar* expressing cells reveal the origin of the thyroid from the pharyngeal endoderm. Stage and probe/staining are indicated as in Figure 1. A-C: Green fluorescent protein (GFP) expression in embryos where Tar* and gfp mRNA was co-injected into one of the outer blastomeres at the eight-cell stage. In A and B, arrowheads indicate GFP expression in the hatching gland, arrows in the pharyngeal endoderm. In C, the arrow points to the thyroid diverticulum that has just lost contact to the pharyngeal endoderm, the arrowhead points to the mouth. A dorsal view, anterior to the top, B; C lateral views, anterior to the left. D: Biotin-dextran detection of a 7-day-old larva after Tar*+biotin-dextran+gfp injection into one of eight outer blastomeres. Biotin-dextran staining is visible in the pharyngeal epithelium (arrowheads) and in a long row of thyroid follicles (arrows). E: Double staining combining tg expresssion and biotin detection in a larva derived from an embryo injected with Tar* as in A-D. F-I: Consecutive staining of tg (F,H) and biotin-dextran (G,I) in an embryo (F,G) and a larva (H, I), both derived from embryos injected with Tar* as in A-E. tg labels the thyroid (blue) as tissue that stains completely overlappingly brown with biotin-dextran detection and, therefore, shows that the whole thyroid is endoderm-derived. lj, lower jaw; m, mouth; p, pharynx. |
|
Mosaic nature of Tar* expressing, labeled cells allows fate mapping and gives insight into the mode of thyroid follicle growth. Stage and probe/staining are indicated as in Figure 1. A: Schematic drawing showing the experimental procedure. See text for details. At shield stage, the embryo is subdivided into six zones (here shown for the right side only), and the position of labeled cells is noted. An example of a resulting embryo at 55 hours postfertilization (hfp) is shown in B and C. B,C: Consecutive staining of nk2.1a (B) and then biotin-dextran (C). In this embryo, at least two cells (arrows) can be found in the thyroid primordium as visualized by nk2.1a. In addition, part of the pharyngeal epithelium is stained (arrowheads). D-G: Selection of specimens where a mosaic of grafted cells (arrows) can be found in thyroid follicles. One-color staining that combines TG immunoreaction in the lumen of the thyroid follicles with cytoplasmic biotin-dextran detection in grafted cells. It is typical that cells around the anterior follicle show stronger biotin-dextran labeling than cells around more posterior follicles. D and E show specimens with many grafted cells. F and G show specimens with few grafted cells. In G, one follicle can be found that lacks grafted cells completely (asterisk), and a single labeled cell can be seen expanding posteriorly (arrowhead). Note that in the depicted specimens, as in most cases, the anterior follicle is larger than more posterior ones. |
|
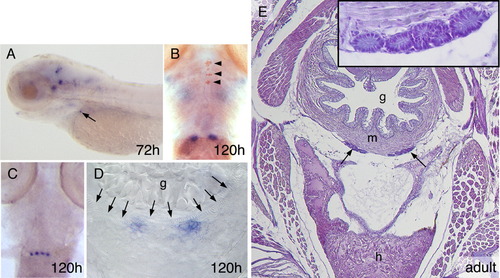
calca is expressed in the ultimobranchial bodies of zebrafish. A-D: calca expression (blue) in zebrafish larvae. Stages, bottom right. A: Expression in the brain and in the ultimobranchial bodies (arrow), lateral view, anterior to the left. B: Double staining with thyroglobulin (TG) immunostaining (arrowheads). C: A specimen with four ultimobranchial bodies instead of the usual two as in B. B and C are ventral views, anterior to the top. D: Cross-section on the level of the ultimobranchial bodies, note the muscle layer (arrows) around the gut that is still filled with yolk. E: Position of the ultimobranchial bodies in the adult zebrafish. Hematoxylin and eosin staining, section on the level of the sinus venosus of the heart. Inset: A close up of the ultimobranchial bodies visualizes their glandular appearance and organization as follicular epithelia. g, gut; h, heart; m, muscle layer of the gut. EXPRESSION / LABELING:
|


