
Fig. 4
- ID
- ZDB-FIG-060620-15
- Publication
- Alt et al., 2006 - Analysis of origin and growth of the thyroid gland in zebrafish
- Other Figures
- All Figure Page
- Back to All Figure Page
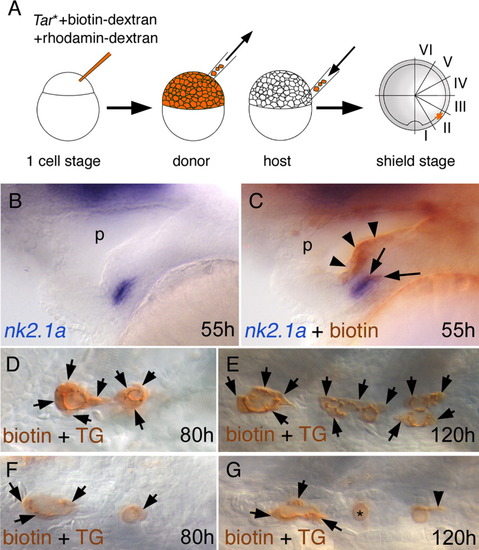
Mosaic nature of Tar* expressing, labeled cells allows fate mapping and gives insight into the mode of thyroid follicle growth. Stage and probe/staining are indicated as in Figure 1. A: Schematic drawing showing the experimental procedure. See text for details. At shield stage, the embryo is subdivided into six zones (here shown for the right side only), and the position of labeled cells is noted. An example of a resulting embryo at 55 hours postfertilization (hfp) is shown in B and C. B,C: Consecutive staining of nk2.1a (B) and then biotin-dextran (C). In this embryo, at least two cells (arrows) can be found in the thyroid primordium as visualized by nk2.1a. In addition, part of the pharyngeal epithelium is stained (arrowheads). D-G: Selection of specimens where a mosaic of grafted cells (arrows) can be found in thyroid follicles. One-color staining that combines TG immunoreaction in the lumen of the thyroid follicles with cytoplasmic biotin-dextran detection in grafted cells. It is typical that cells around the anterior follicle show stronger biotin-dextran labeling than cells around more posterior follicles. D and E show specimens with many grafted cells. F and G show specimens with few grafted cells. In G, one follicle can be found that lacks grafted cells completely (asterisk), and a single labeled cell can be seen expanding posteriorly (arrowhead). Note that in the depicted specimens, as in most cases, the anterior follicle is larger than more posterior ones. |