
Fig. 3
- ID
- ZDB-FIG-060620-14
- Publication
- Alt et al., 2006 - Analysis of origin and growth of the thyroid gland in zebrafish
- Other Figures
- All Figure Page
- Back to All Figure Page
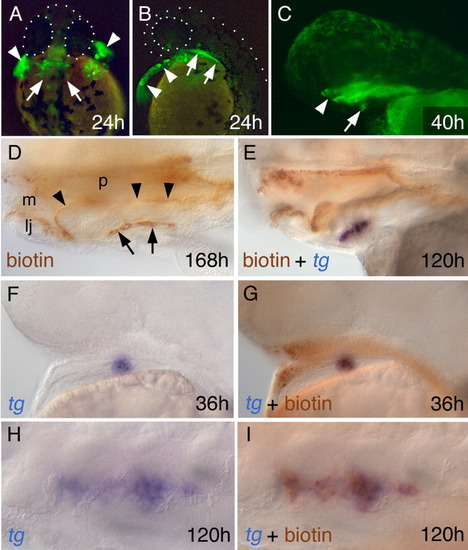
Tar* expressing cells reveal the origin of the thyroid from the pharyngeal endoderm. Stage and probe/staining are indicated as in Figure 1. A-C: Green fluorescent protein (GFP) expression in embryos where Tar* and gfp mRNA was co-injected into one of the outer blastomeres at the eight-cell stage. In A and B, arrowheads indicate GFP expression in the hatching gland, arrows in the pharyngeal endoderm. In C, the arrow points to the thyroid diverticulum that has just lost contact to the pharyngeal endoderm, the arrowhead points to the mouth. A dorsal view, anterior to the top, B; C lateral views, anterior to the left. D: Biotin-dextran detection of a 7-day-old larva after Tar*+biotin-dextran+gfp injection into one of eight outer blastomeres. Biotin-dextran staining is visible in the pharyngeal epithelium (arrowheads) and in a long row of thyroid follicles (arrows). E: Double staining combining tg expresssion and biotin detection in a larva derived from an embryo injected with Tar* as in A-D. F-I: Consecutive staining of tg (F,H) and biotin-dextran (G,I) in an embryo (F,G) and a larva (H, I), both derived from embryos injected with Tar* as in A-E. tg labels the thyroid (blue) as tissue that stains completely overlappingly brown with biotin-dextran detection and, therefore, shows that the whole thyroid is endoderm-derived. lj, lower jaw; m, mouth; p, pharynx. |