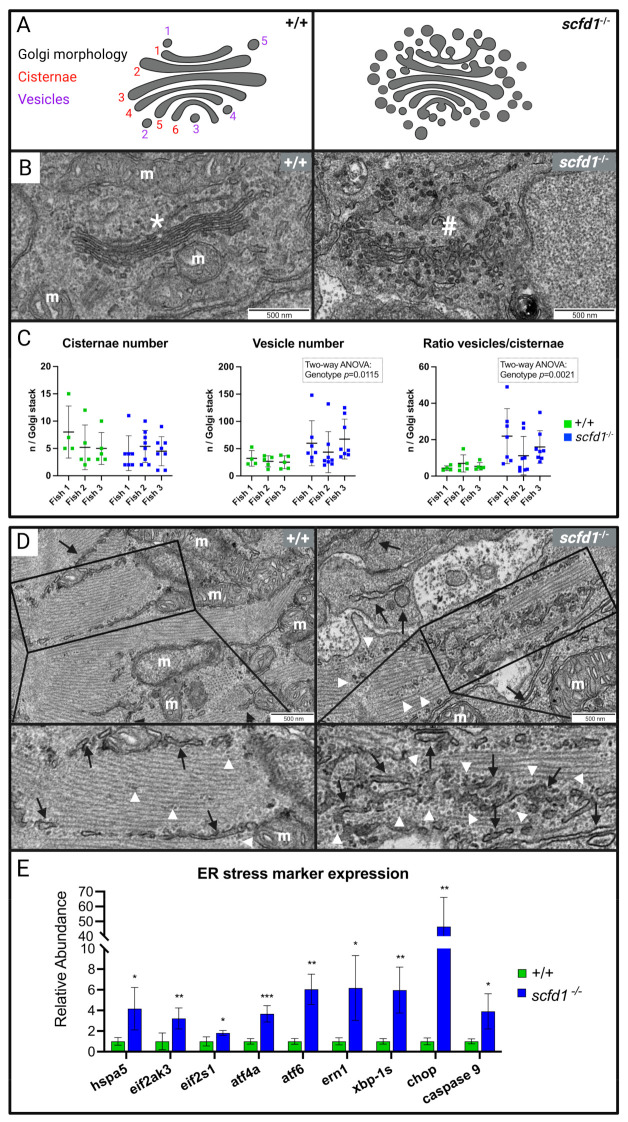
IMAGE

Figure 5

ID
ZDB-IMAGE-231030-122
Source
Figures for Huttner et al., 2023
Image
Figure Caption

Figure 5

Altered cardiomyocyte Golgi apparatus and reticular network morphology, and upregulation of endoplasmic reticulum (ER) stress markers in scfd1 mutant hearts at 3 dpf. (A) Schematic of normal (left, wildtype (WT; +/+) and altered (right, scfd1vcc44−/−) Golgi morphology with delineation of Golgi cisternae and vesicles. (B) High magnification electron micrographs showing representative examples of ordered Golgi stack (*) in +/+ (left) and highly vesiculated Golgi stack (#) in scfd1 mutant (right); m = mitochondria. (C) Scatter graphs showing increased vesiculation and vesicle/cisternae ratio in Golgi stacks of scfd1 mutants in comparison to +/+ (n = 4–5 Golgi stacks per fish in +/+, n = 7–8 Golgi stacks per fish in scfd1−/−). (D) Low and high magnification electron micrographs showing normal smooth ER/sarcoplasmic reticulum (SR; black arrows) with occasional clusters of free ribosomes (white arrow heads) in WT cardiomyocytes (left) vs. fractionated, dispersed, and variably sized ER/SR (black arrows), and increased presence of free and membrane-bound ribosomes (white arrow heads) in scfd1vcc44−/− mutants (right). (E) Column graph showing significantly elevated transcriptional expression of ER stress markers in scfd1vcc44−/− embryos relative to their expression in WT; n = 5 samples of 30 pooled 3 dpf embryos per genotype. Zebrafish orthologs and mammalian counterparts: hspa5 = GRP78, eif2ak3 = PERK, eif2s-1 = eIF2a, atf4a = ATF4, atf6 = ATF6, ern1 = IRE1. * if p= 0.05-0.001; ** if p= 0.001-0.0001; *** if p<0.0001. Created with BioRender.com.

Acknowledgments
This image is the copyrighted work of the attributed author or publisher, and ZFIN has permission only to display this image to its users. Additional permissions should be obtained from the applicable author or publisher of the image. Full text @ J Cardiovasc Dev Dis