
Figure 1
- ID
- ZDB-IMAGE-230826-1
- Genes
- Publication
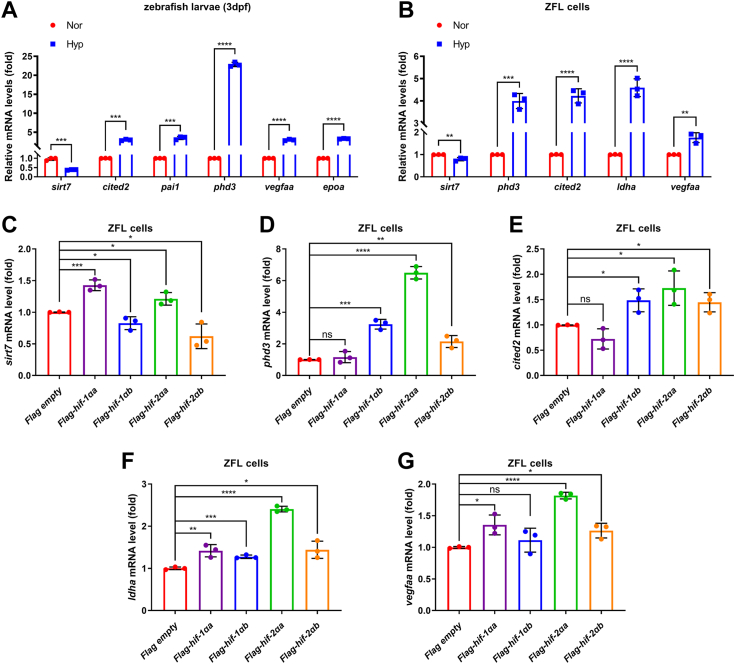
- Liao et al., 2023 - Disruption of sirtuin 7 in zebrafish facilitates hypoxia tolerance
- All Figures
- Figures for Liao et al., 2023
|
Figure 1