
Fig. 1
|
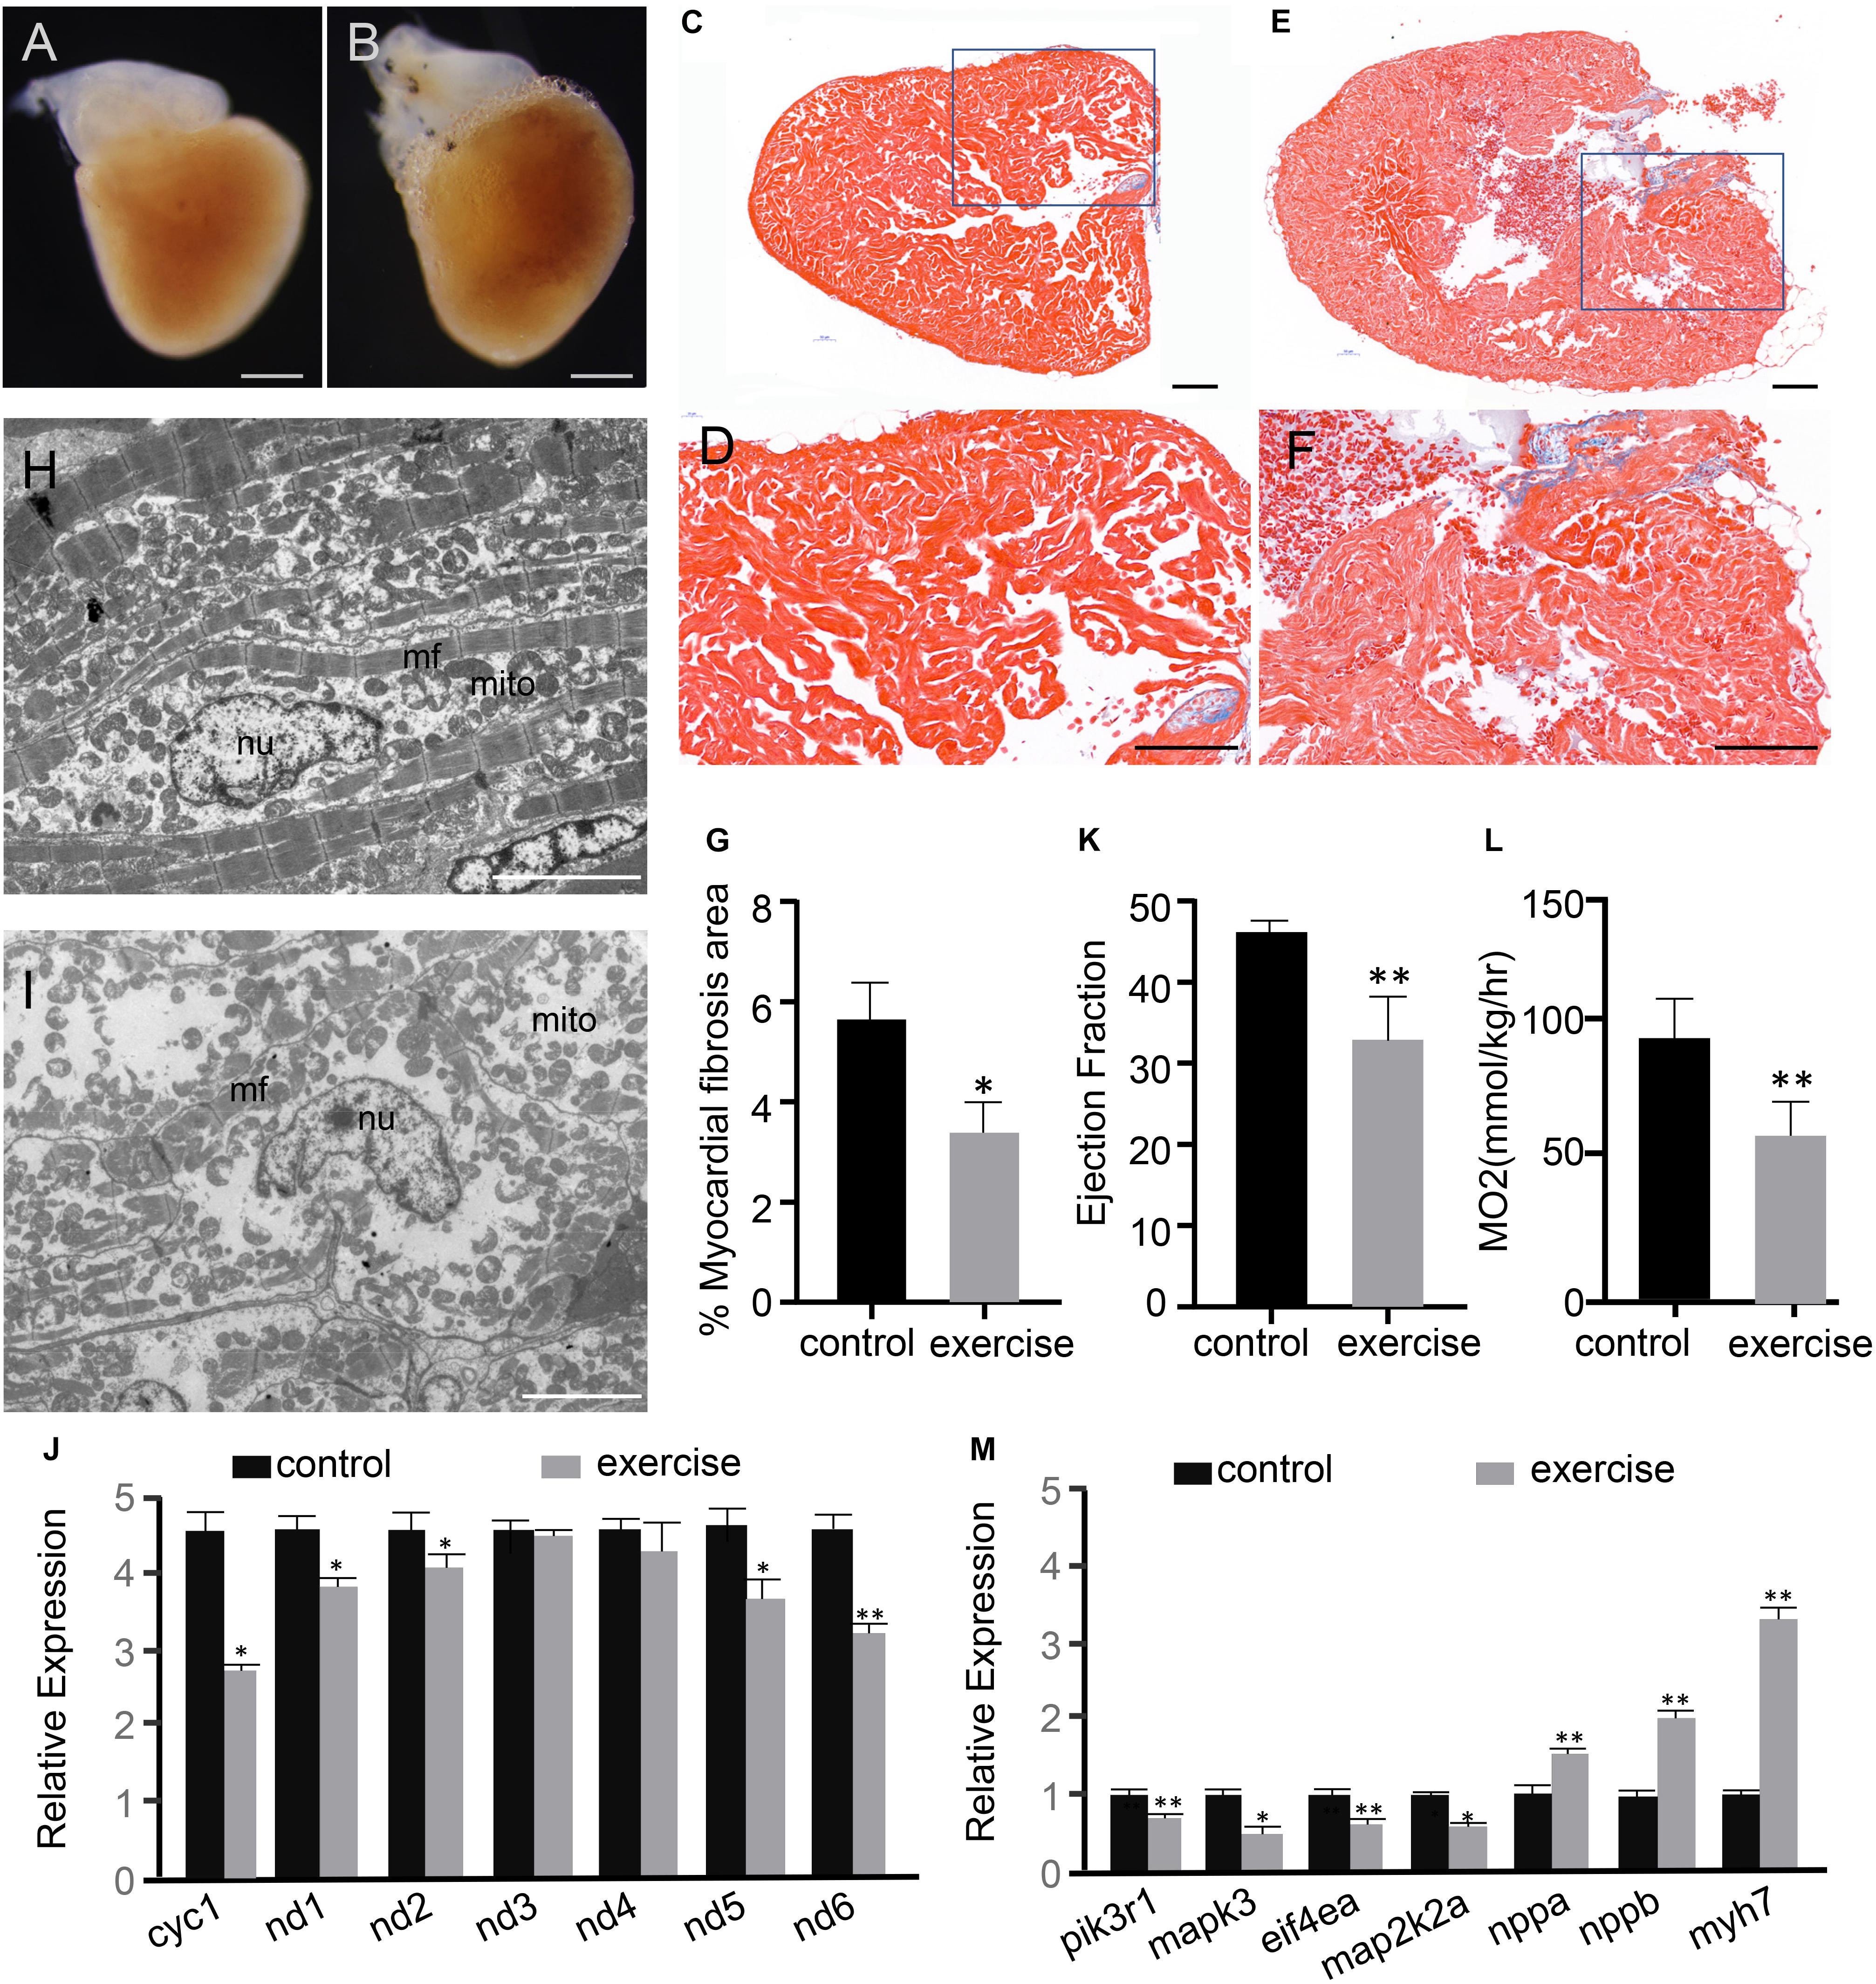
Fig. 1 Figure 1. Excessive exercise leads to pathological cardiac hypertrophy. (A,B) Representative images from control (A) and excessively-exercised zebrafish hearts (B) after 4 weeks of static and excessive-exercise treatment. (C–F) Representative pictures of Masson’s trichrome-stained ventricular tissues of control (C,D) and excessively-exercised zebrafish hearts (E,F). Blue area indicates fibrosis. (D,F) Are enlargements of the rectangle area in (C,E), respectively. Scale bar = 100 μm. (G) Quantitative analysis of Masson staining positive myocardial fibrosis area using Image J. ∗p < 0.05 by unpaired Student’s t-test. n = 3. (H,I) TEM images of control (H) and excessively exercised heart tissue (I). Scale bar = 5 μm. (J) RT-qPCR analysis of the expression of mitochondrial functional markers. ∗p < 0.05, ∗∗p < 0.01 by unpaired Student’s t-test. (K) Echocardiographic analysis of zebrafish after excessive exercise and in the static control (LVPW, LV posterior wall thickness). Error bars indicate SEM. n = 4. (L) The maximal oxygen consumption (MO2) of zebrafish after excessive exercise and in the control group was analyzed. n = 8. (M) RT-qPCR analysis of the expression of pathologic and physiological hypotrophy-related marker genes. ∗p < 0.05, ∗∗p < 0.01 by unpaired Student’s t-test.