
Fig. 2
|
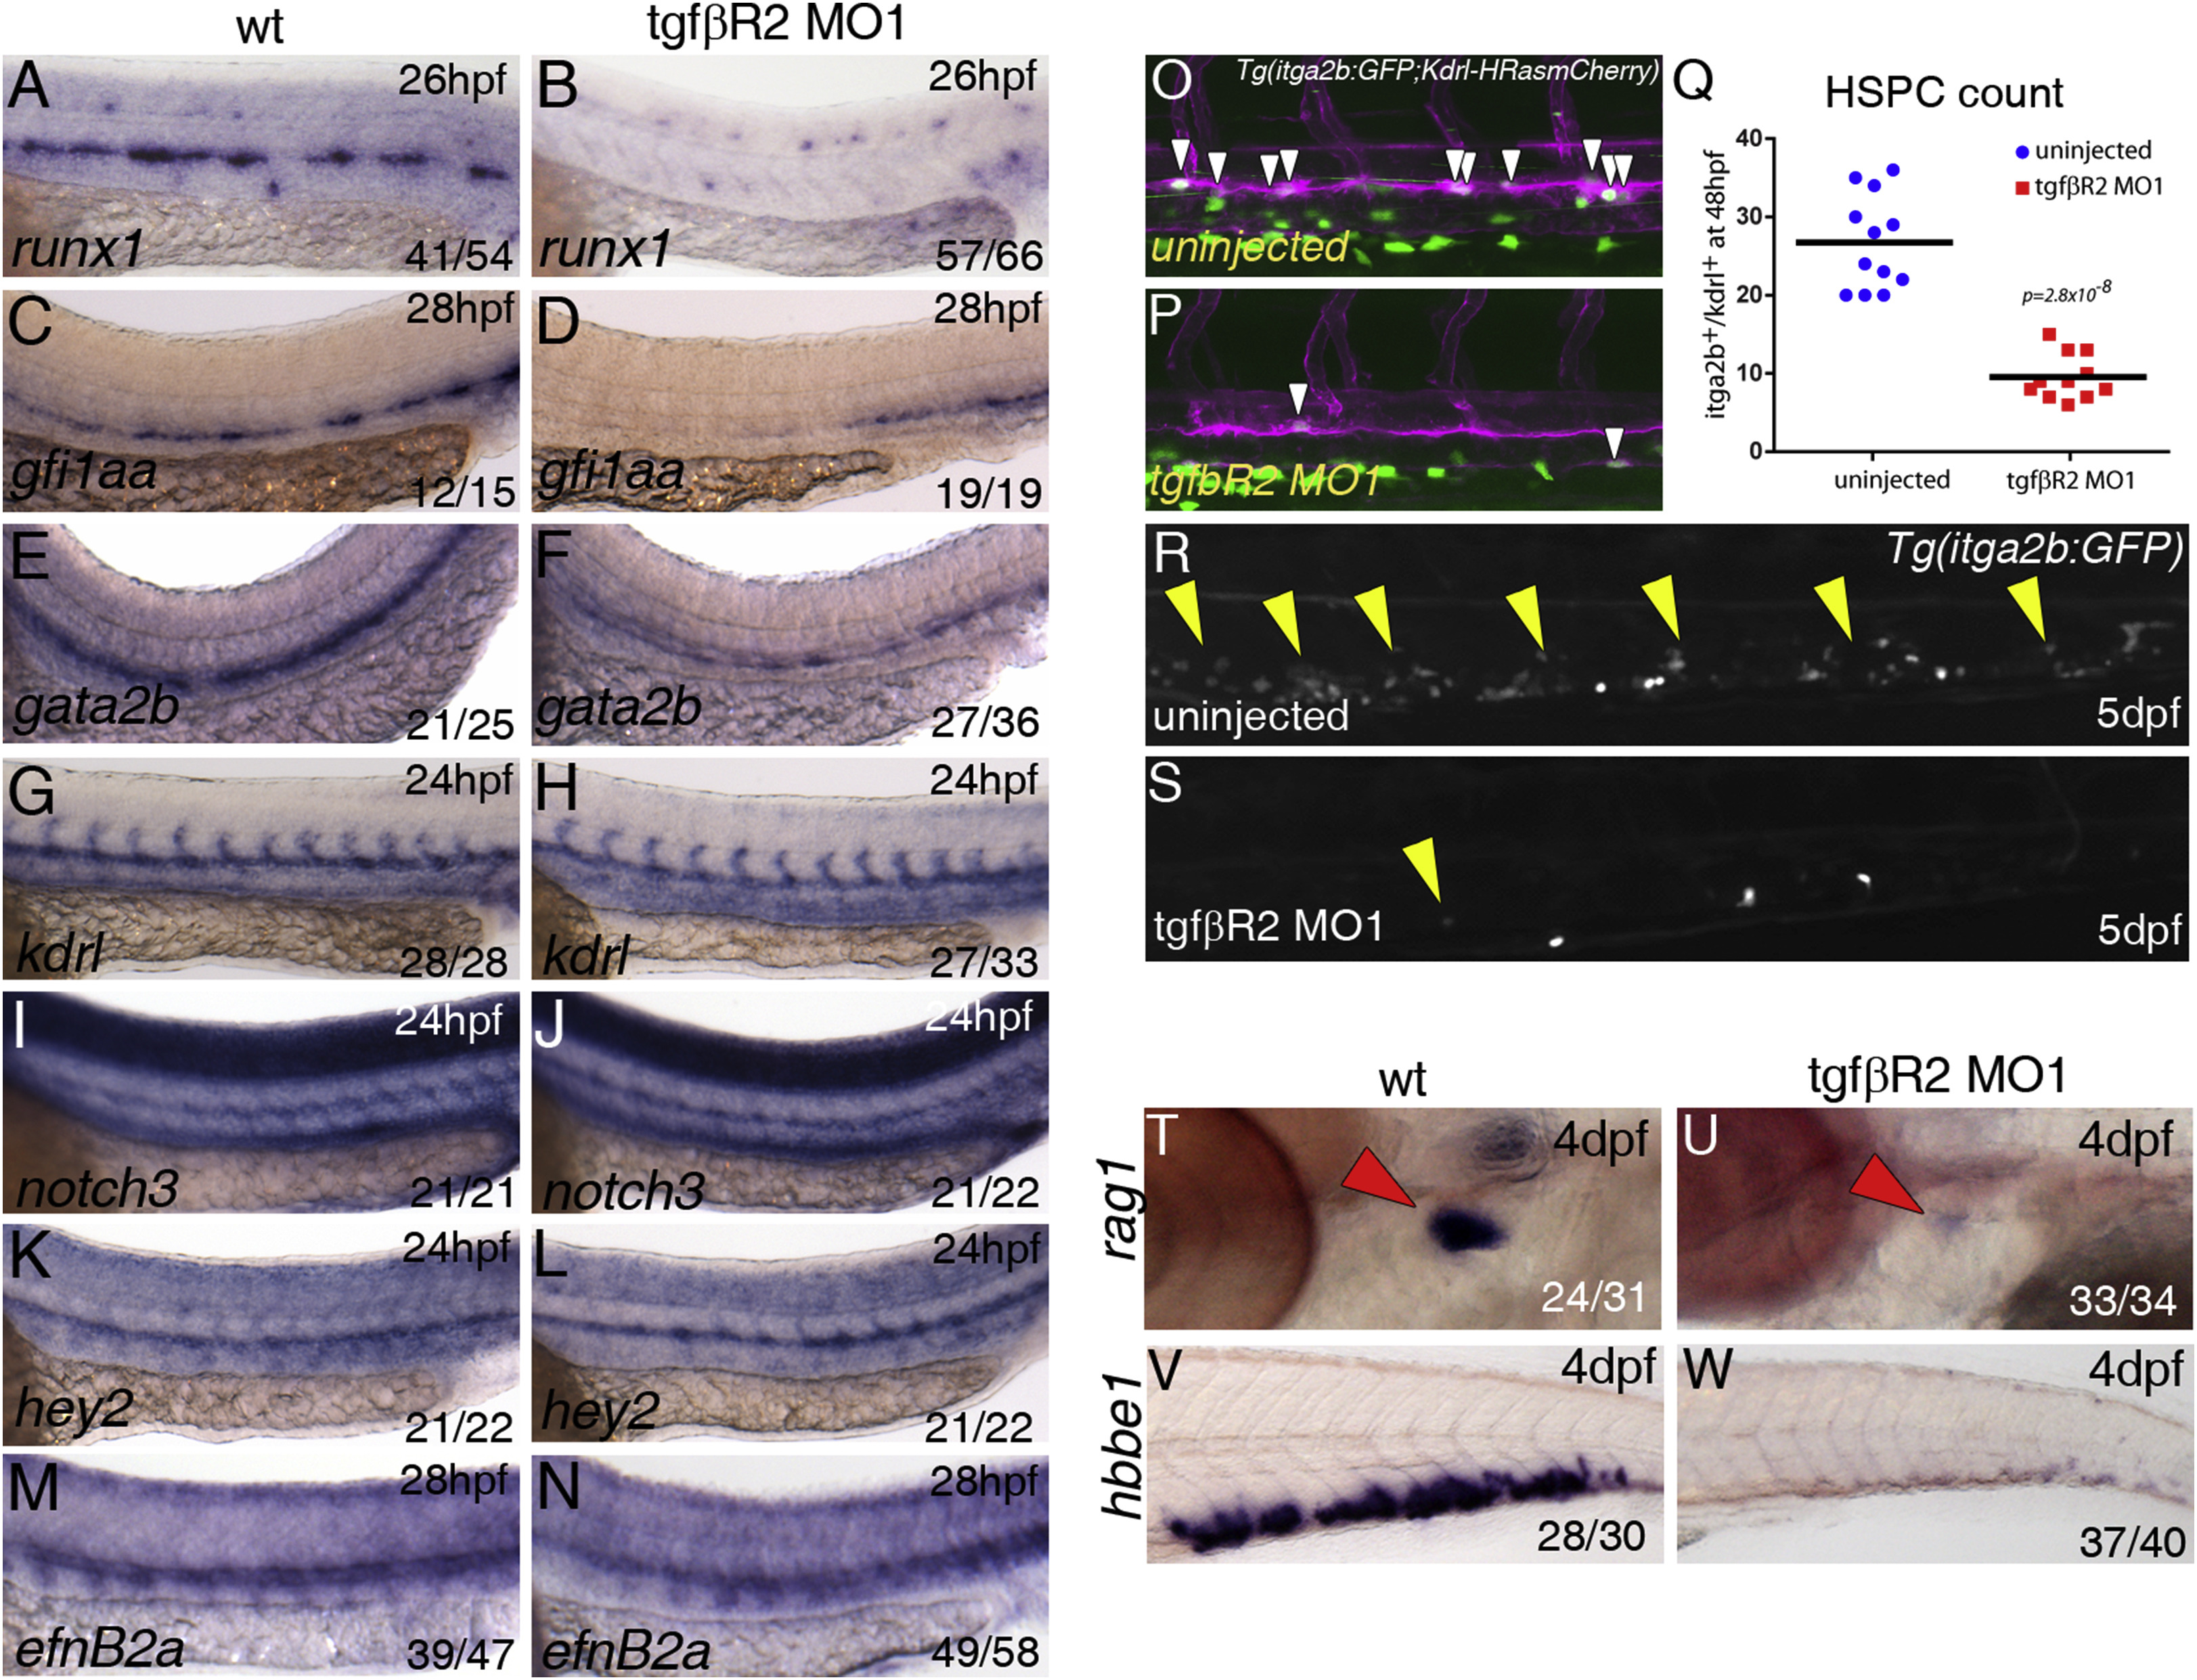
Fig. 2
TGFβ Signaling Is Required for Specification of HSCs
Expression of runx1 in (A) wild-type (wt) and (B) tgfbr2 morphants at 26 hpf. Expression of gfi1aa in (C) wild-type or (D) tgfbr2 morphants at 26 hpf. Expression of gata2b in (E) wild-type or (F) tgfbr2 morphants at 26 hpf.
Expression of the vascular marker kdrl (G, H) and the arterial markers notch3 (I, J), hey2 (K, L), and efnB2A (M, N) is unaffected in tgfbR2 morphants. Maximum projections of itga2b:GFP; Kdrl:HRas-mCherry transgenic embryos at 48 hpf in (O) uninjected and (P) tgfbr2 MO1-injected embryos. Region shown includes part of the DA and white arrowheads denote itga2b:GFP+(green), kdrl:HRas-mCherry+ (magenta) HSPCs.
(Q) HSPC counts in the entire trunk region of uninjected and tgfbR2 morphant itga2b:GFP; Kdrl:HRas-mCherry transgenic embryos at 48 hpf (p value is indicated on the graph, n = 12 (wild-type) and n = 11 (tgfbR2MO1).
itga2b-GFP+ cells are present in the CHT of itga2b:GFP embryos (R, yellow arrowheads) and greatly reduced in the CHT of tgfbR2 morphants at 5 dpf (S). Expression of rag1 in the thymus (red arrowheads) at 4 dpf in (T) wild-type and (U) tgfbR2 morphants. Expression of hbbe1 in the CHT at 4 dpf in (V) wild-type and (W) tgfbR2 morphants.
The numbers of embryos are shown in each panel as the number of embryos with phenotype/total number analyzed. See also Figure S2.
Reprinted from Developmental Cell, 38(4), Monteiro, R., Pinheiro, P., Joseph, N., Peterkin, T., Koth, J., Repapi, E., Bonkhofer, F., Kirmizitas, A., Patient, R., Transforming Growth Factor β Drives Hemogenic Endothelium Programming and the Transition to Hematopoietic Stem Cells, 358-70, Copyright (2016) with permission from Elsevier. Full text @ Dev. Cell