
Fig. 2
|
Fig. 2
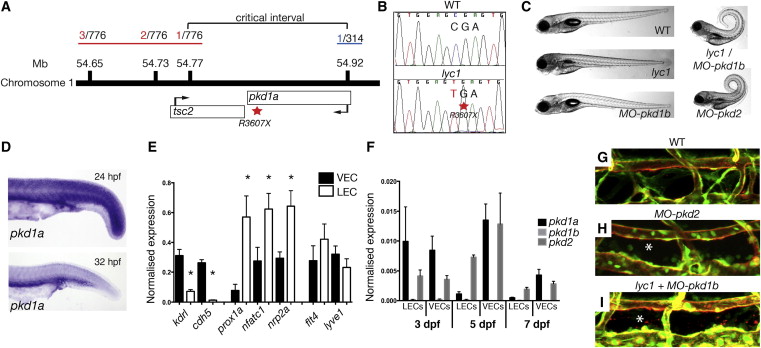
lyc1 Is a pkd1a Mutant
(A) Overview of positional cloning of lyc1. Individual recombinant embryos (labeled in red left [from 776 embryos analyzed], labeled in blue right [from 314 embryos analyzed]) identify flanking polymorphic markers and limit the critical interval to a region containing partial sequences for pkd1a and tsc2.
(B) Sequence chromatograms showing the wild-type (upper) and pkd1a mutant (R3607X, lower) sequences.
(C) Overall morphology of 5 dpf WT, lyc1, MO-pkd1b, lyc1/MO-pkd1b, and MO-pkd2 embryos. The injection of MO-pkd1b into lyc1 mutants recapitulates the published MO-pkd1a/1b double loss-of-function phenotype ( Mangos et al., 2010).
(D) Expression pattern of pkd1a by in situ hybridization in the trunk of wild-type zebrafish at 24 hpf and 32 hpf.
(E) Quantitative RT-PCR for markers enriched in venous endothelial cells (VECs); kdrl, cdh5, LECs; prox1a, nfatc1, nrp2a; and both flt4 and lyve1 demonstrated the purity of FACS-isolated populations at 5 dpf.
(F) Quantitative RT-PCR for pkd1a, pkd1b, and pkd2 transcripts in 3, 5, and 7 dpf VEC and LEC populations.
(G–I) The vasculature of 5 dpf WT, lyc1/MO-pkd1b and MO-pkd2 embryos (5 and 7.5 ng MO, respectively); asterisk indicates absence of thoracic duct in Tg(fli1a:EGFPy1; kdrl:egfps843) embryos.
Error bars indicate SEM. See also Figures S3 and S4.