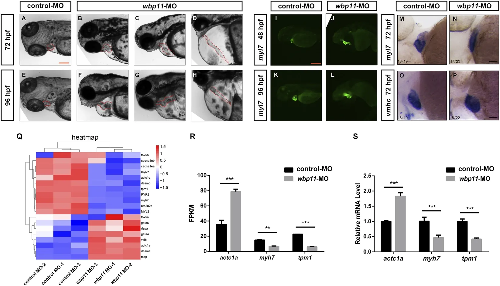
Knockdown of wbp11 leads to cardiac defects in zebrafish. (A–H) Bright-field microscopy observation of cardiac morphology in zebrafish larvae. (A–D) 72 hpf; (E–H) 96 hpf. (A,E) Control-MO; (B–D,F–H) wbp11-MO. (I–L) Fluorescence microscopy observation of cardiac morphology in Tg(myl7:EGFP) zebrafish larvae. (I,J) 48 hpf; (K,L) 96 hpf. Red scale bar: 200 μm (applies to (A–L)). (M–P) Whole-mount in situ hybridization of zebrafish larvae at 72 hpf using myl7 and vmhc probes to assess cardiac morphology. Black scale bar: 125 μm (applies to (M–P)). (Q) Heatmap analysis of cardiac-related differentially expressed genes (DEGs). Blue indicates downregulated genes, and red indicates upregulated genes. (R) FPKM values of representative cardiac genes actc1a, myh7, and tpm1 (n = 3; biologically independent experiments, each performed with 50 pooled embryos per group. Data are presented as mean ± SEM. **p < 0.01, ***p < 0.001). (S) qPCR analysis of transcript levels of representative cardiac genes actc1a, myh7, and tpm1 (n = 3; biologically independent experiments, each performed with 50 pooled embryos per group. Data are presented as mean ± SEM. ***p < 0.001).
|
