
Figure 1
- ID
- ZDB-FIG-260917-7
- Publication
- Chen et al., 2026 - Loss of wbp11 causes multi-system developmental defects: a zebrafish model of VACTERL association
- Other Figures
- All Figure Page
- Back to All Figure Page
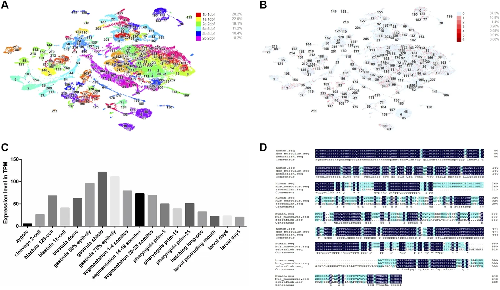
Bioinformatics analysis of wbp11. (A) UMAP clustering plots at different developmental stages (1 dpf, 2 dpf, and 5 dpf) retrieved from the UCSC Cell Browser platform. Different colors represent distinct clusters. (B) UMAP plot showing wbp11 gene expression. (C) Expression levels of zebrafish wbp11 at various stages of early embryonic development retrieved from the Expression Atlas database. TPM (transcripts per million) represents normalized gene expression counts calculated from raw sequencing data. (D) Amino acid sequence alignment of WBP11 across different species, including human, mouse, and zebrafish. |