
Figure 4
- ID
- ZDB-FIG-260917-10
- Publication
- Chen et al., 2026 - Loss of wbp11 causes multi-system developmental defects: a zebrafish model of VACTERL association
- Other Figures
- All Figure Page
- Back to All Figure Page
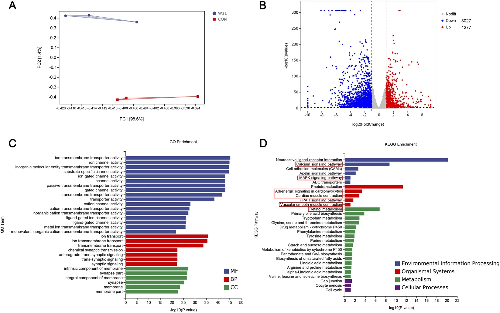
Transcriptome analysis of zebrafish embryos at 72 hpf following wbp11-MO knockdown. (A) Principal component analysis (PCA) of RNA-seq data. The horizontal axis represents the first principal component (PC1), and the vertical axis represents the second principal component (PC2). Each dot corresponds to an individual sample, with colors indicating different groups (red: Control-MO; blue: wbp11-MO). (B) Volcano plot of differentially expressed genes (DEGs). Blue dots represent significantly downregulated genes (n = 3,027), red dots represent significantly upregulated genes (n = 1,277), and gray dots represent genes with no significant differential expression. (C) Gene Ontology (GO) enrichment analysis of DEGs (top 30 terms). MF: molecular function; BP: biological process; CC: cellular component. (D) Kyoto Encyclopedia of Genes and Genomes (KEGG) pathway enrichment analysis of DEGs (top 30 pathways). |