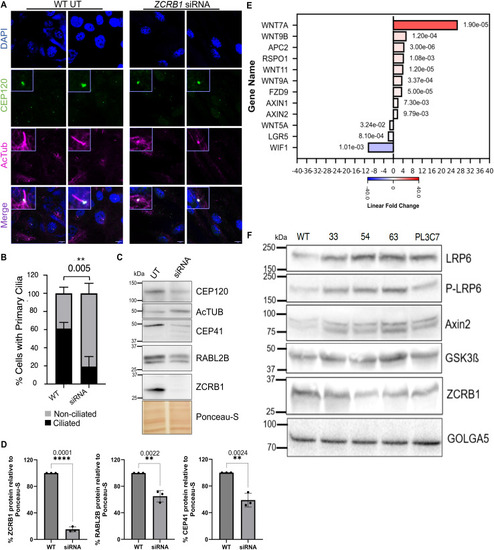
Loss of ZCRB1 leads to decreased cilium formation and an up-regulation of WNT signaling.
(A) Representative images from immunofluorescence labeling of centrioles (CEP-120, green) and primary cilia (acetylated tubulin, magenta) in RPE-1 cells treated with control or ZCRB1 siRNA (scale bar: 10 μm). (B) Quantification of the percent number of cells (50 cells per replicate) with and without primary cilia in control versus ZCRB1 siRNA-treated RPE-1 cells. Statistics were calculated using an unpaired t test. (C) Western blot analysis of primary cilia–associated proteins after siRNA-mediated ZCRB1 knockdown in RPE-1 cells versus untreated (UT) control cells. (D) Quantification of proteins shown in C relative to Ponceau S (total protein) using a percentage scale. Error bars in all graphs represent the mean ± s.d. P-values are shown and measured by an unpaired t test. (E) Bar plot of canonical and noncanonical human WNT pathway genes differentially expressed by RNA sequencing between ZCRB1-heterozygous cells versus WT cells (FDR ≤ 0.05 and absolute linear fold change ≥1.5). Red and blue bars represent up-regulated and down-regulated linear fold changes, respectively. The color intensity within the bar denotes the degree of expression change. The FDR values for each gene are displayed next to their respective bars. (F) Western blot analysis of WNT signaling proteins in ZCRB1-heterozygous cells versus WT control cells. Vertical lanes represent samples from the WT (HEK293 Flp-In cells) and ZCRB1-heterozygous clones, 33, 54, 63, and PL3C7. ZCRB1 and GOLGA5 are shown again from Fig 1A as a part of a larger panel displaying WNT targets. Molecular weight markers in kD are shown. Equal protein was used for analysis, and loading was normalized to GOLGA5 levels; quantification is provided in Fig S8A and B.
|
