
FIGURE
Figure S3.
- ID
- ZDB-FIG-260530-17
- Publication
- Pirzada et al., 2026 - Loss of U11/U12 spliceosome gene ZCRB1 leads to aberrant ciliogenesis and WNT signaling
- Other Figures
- All Figure Page
- Back to All Figure Page
Figure S3.
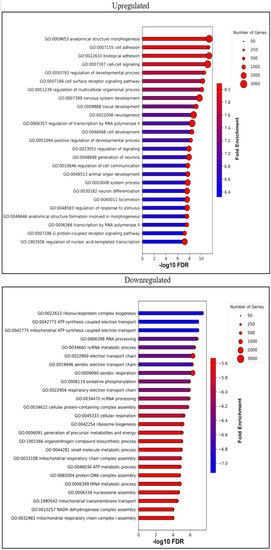
Gene set enrichment analysis of ZCRB1-heterozygous HEK293 cells based on RNA-sequencing data. |
Expression Data
Expression Detail
Antibody Labeling
Phenotype Data
Phenotype Detail
Acknowledgments
This image is the copyrighted work of the attributed author or publisher, and
ZFIN has permission only to display this image to its users.
Additional permissions should be obtained from the applicable author or publisher of the image.
Full text @ Life Sci Alliance