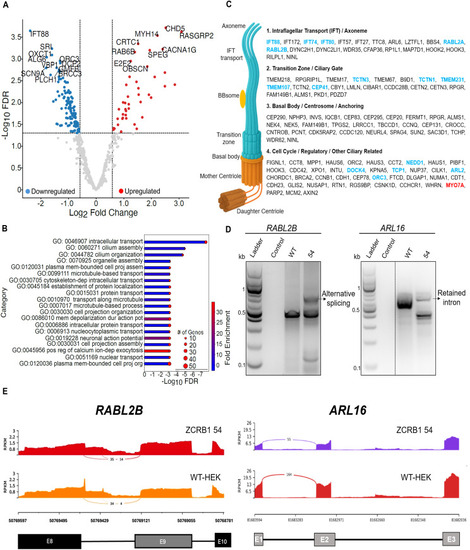
ZCRB1 regulates ciliary genes by regulating the alternative splicing of minor introns.
(A) Volcano plot showing DE of minor intron–containing genes as identified by RNA-sequencing analysis between the four described ZCRB1-heterozygous HEK293 Flp-in clones and WT cells. The red and blue dots denote significantly up-regulated and down-regulated genes, respectively, whereas the gray dots denote genes with no significant change. The vertical dashed lines represent the cutoff for significant fold change (log2 FC of ≥ 0.58 or ≤−0.58), whereas the horizontal line signifies the FDR significance cutoff (≤0.05). (B) Bar plot representation of the top significantly enriched biological processes identified by analysis of the DE minor intron–containing genes in ZCRB1-heterozygous cells versus WT cells. The length of bars is proportional to the FDR (adjusted P-value), and the shading within the bar represents the degree of linear fold change. The size of the red dots on the end of the bars represents the number of genes present in each identified pathway. (C) Schematic diagram of all (116) primary cilia and centrosome genes, grouped by their published function that were perturbed in ZCRB1-heterozygous cells. The bold ones are all minor intron–containing genes: blue ones are all down-regulated, and the red one is up-regulated. All 116 cilium-related differential proteins were manually and individually categorized based on information available in the Human Protein Atlas and other cilium-related studies. The cilium-generated image was also labeled to spatially reflect the localization of ciliary proteins. (D) RT–PCR results of respective complete coding sequences of RABL2B and ARL16 in ZCRB1-heterozygous cells (clone 54). The dotted line represents a cropped lane from the same gel at the same exposure. (E) IGV snapshots of ciliary genes with splicing alterations indicated by rMATS. RABL2B shows both exon-skipping (ES) and mutually exclusive exon events, whereas ARL16 shows mutually exclusive exon, retention of intron (RI), and ES events.
|
