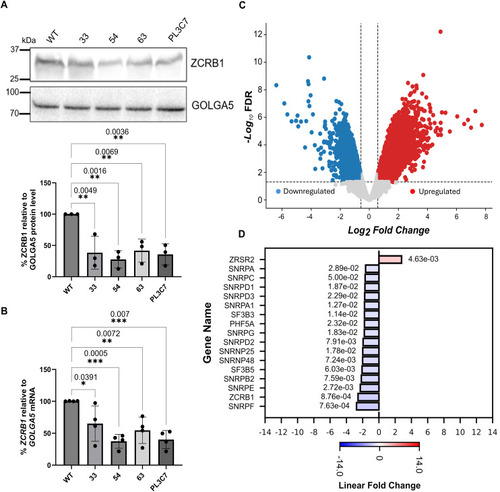
ZCRB1 levels are reduced in ZCRB1-heterozygous HEK293 cells.
(A) Western blot analysis of HEK293 Flp-In cell lines with heterozygous loss of ZCRB1. ZCRB1 protein expression is shown for parental WT HEK293 cells and the 33, 54, 63, and PL3C7 clones, quantified relative to GOLGA5 as the control. Molecular weight markers in KiloDalton (kD) are shown. (B)ZCRB1 mRNA levels in heterozygous knockout clones 33, 54, 63, and PL3C7 versus WT HEK293 Flp-In cell levels as quantified by qRT-PCR. Relative mRNA levels for each clone are shown as a percentage of WT expression. Error bars in both graphs represent the mean ± s.d. P-values are shown and were calculated by an ordinary one-way ANOVA with Dunnett’s multiple comparisons test. (C) Volcano plot of differentially expressed (DE) genes identified by RNA-sequencing analysis between the 4 ZCRB1-heterozygous HEK293 Flp-In clone cell lines and WT cells. The red and blue dots denote significantly up-regulated and down-regulated genes, respectively, whereas the gray dots represent genes with no changes in their expression (nonsignificant). The vertical dashed lines represent the cutoff for significant fold change (log2 fold change of ≥ or ≤0.58), whereas the horizontal line signifies the FDR significance cutoff (≤0.05). (D) Bar plot of DE genes associated with both the major and minor human spliceosomes (FDR ≤ 0.05, linear FC ≥ 1.5) as identified by RNA-sequencing analysis. Red and blue bars denote up-regulated and down-regulated linear fold changes, respectively. The FDR values for each gene expression level are displayed adjacent to its respective bar.
|
