
Fig. 6 - Supplemental 3
- ID
- ZDB-FIG-260520-51
- Publication
- Wafer et al., 2026 - A quantitative in vivo CRISPR-imaging platform identifies regulators of hyperplastic and hypertrophic adipose morphology in zebrafish
- Other Figures
- All Figure Page
- Back to All Figure Page
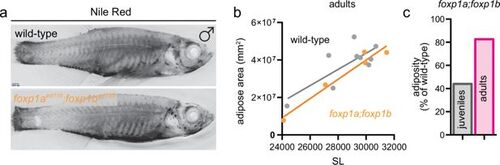
Adiposity in adult foxp1aed116;foxp1bed125 zebrafish mutants. (a) Representative Nile Red-stained images of adult male wild-type and foxp1aed116;foxp1bed125 double mutant zebrafish. Lipid-rich adipose tissue appears as a dark black signal. Scale bar = 1 mm. (b) Total adipose area plotted against standard length (SL, μm) in adult wild-type (grey) and foxp1a;foxp1b mutants (orange). A regression line is fitted for each group, showing reduced adiposity in mutants relative to controls (μm2). (c) Comparison of adiposity in foxp1a;foxp1b mutants relative to wild-type siblings at juvenile and adult stages. While adiposity was markedly reduced in juveniles, it recovered to ~80% of wild-type levels by adulthood. |