
Fig. 6 - Supplemental 2
- ID
- ZDB-FIG-260520-50
- Publication
- Wafer et al., 2026 - A quantitative in vivo CRISPR-imaging platform identifies regulators of hyperplastic and hypertrophic adipose morphology in zebrafish
- Other Figures
- All Figure Page
- Back to All Figure Page
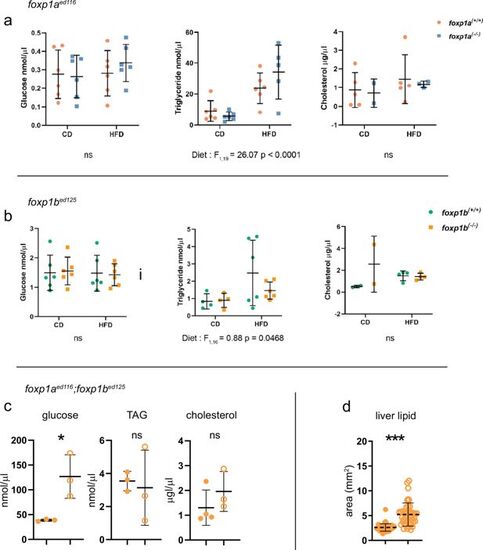
Metabolic phenotypes of foxp1a, foxp1b, and foxp1a;foxp1b mutant zebrafish following dietary challenge. (a) Plasma glucose, triglyceride (TAG), and cholesterol levels in foxp1aed116 mutants and wild-type siblings under control diet (CD) or high-fat diet (HFD) conditions. HFD induced a significant increase in TAG across genotypes (two-way ANOVA: F1,19 = 26.07, p<0.0001). No significant genotype or diet effects were observed for glucose or cholesterol. (b) Plasma glucose, TAG, and cholesterol in foxp1bed125 mutants and wild-type controls under CD and HFD. TAG levels were modestly influenced by diet (two-way ANOVA: F1,16=0.88, p=0.0468), with no significant effects detected for glucose or cholesterol. (c) Circulating glucose, TAG, and cholesterol levels in foxp1aed116;foxp1bed125 double mutants. Double mutants exhibited significantly elevated glucose levels (p<0.05, unpaired t-test), while TAG and cholesterol levels were unchanged. (d) Quantification of liver lipid accumulation in foxp1aed116;foxp1bed125 double mutants revealed significantly increased hepatic lipid deposition compared to controls (p<0.001, unpaired t-test). Error bars represent standard deviation (SD). ns = not significant. |