
Fig. 1 - Supplemental 2
- ID
- ZDB-FIG-260520-42
- Publication
- Wafer et al., 2026 - A quantitative in vivo CRISPR-imaging platform identifies regulators of hyperplastic and hypertrophic adipose morphology in zebrafish
- Other Figures
- All Figure Page
- Back to All Figure Page
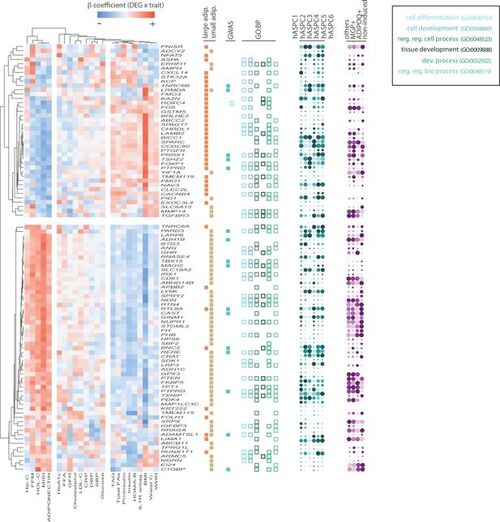
Integrative analysis of adipose morphology genes across cardiometabolic traits, genome-wide association study (GWAS) loci, Gene Ontology (GO) terms, and single-cell expression profiles. The 102 candidate morphology genes enriched in adipose stem and progenitor cells (ASPCs) were characterised across multiple data sources. Left panel: Heatmap of β coefficients from linear regression of gene expression in human subcutaneous adipose tissue (SAT) against 23 cardiometabolic traits from the METSIM cohort (Civelek et al., 2017). Blue indicates negative and red indicates positive associations. Genes and traits are hierarchically clustered. Traits include measures of body composition and adiposity (body mass index [BMI], waist circumference, waist-to-hip ratio [WHR], hip circumference, FM), lipids (HDL-C, LDL-C, cholesterol, TAG, total FAs, FFA), glycaemia and insulin sensitivity (HbA1c, glucose, insulin, proinsulin, HOMA-B, Muscle Insulin Sensitivity Index [MISI]), inflammation (CRP, IL-1R antag.), blood pressure (SBP, DBP), renal function (GFR), and adipokines (adiponectin). Centre columns (left to right): Adipocyte size association – brown and orange bars indicate genes enriched in large or small adipocytes, respectively (Honecker et al., 2022). GWAS overlap – teal boxes indicate genes at genome-wide significant loci for BMI or WHR-adjusted BMI. GO biological process – colour-coded boxes indicate membership in enriched GO terms as shown in the legend: cell differentiation (GO:0030154), cell development (GO:0048869), negative regulation of cellular process (GO:0048523), tissue development (GO:0009888), developmental process (GO:0032502), and negative regulation of biological process (GO:0048519). Right panel: Dot plots showing expression of each gene across human WAT single-cell clusters (Emont et al., 2022; Yang Loureiro et al., 2023). Dot size represents percentage of cells expressing; colour intensity represents scaled mean expression. Cell populations shown are: human ASPC subclusters (hASPCs1-6), MGP+, ADIPOQ+ non-induced progenitors, and others. |