
Fig. 3
- ID
- ZDB-FIG-260520-44
- Publication
- Wafer et al., 2026 - A quantitative in vivo CRISPR-imaging platform identifies regulators of hyperplastic and hypertrophic adipose morphology in zebrafish
- Other Figures
- All Figure Page
- Back to All Figure Page
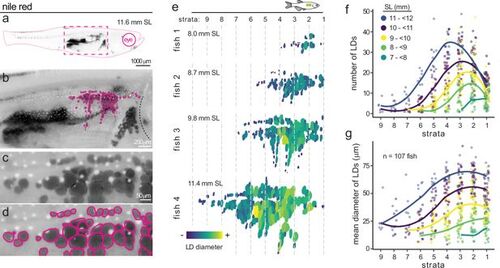
Spatial dynamics of subcutaneous adipose growth in zebrafish. (a) Nile Red-stained zebrafish at 11.6 mm standard length (SL). Black signal denotes Nile Red-positive neutral lipid within adipose tissue. Magenta dashed box indicates the region shown in (b). (b) Higher magnification of the subcutaneous adipose depot. Magenta outlines highlight segmented lipid droplets (LDs). Dashed line indicates the operculum. (c) Zoomed view of individual subcutaneous adipose LDs. White dots are melanosome pigment granules. (d) LD segmentation masks (magenta outlines) corresponding to (c). (e) Segmented subcutaneous adipose LDs from four representative zebrafish of increasing body size, colour-coded by LD diameter. Fish sizes are shown in mm SL. Dashed lines demarcate strata defined at 200 μm intervals from the most anterior LD. (f) Number of LDs per stratum as a function of zebrafish body size. Fish were grouped into five SL categories (colour-coded). Lines represent fitted curves; dots represent individual fish. (g) Mean LD diameter per stratum as a function of zebrafish body size (n=107 fish). Lines and colour coding as in (f). |