
Fig. 1 - Supplemental 1
- ID
- ZDB-FIG-260520-41
- Publication
- Wafer et al., 2026 - A quantitative in vivo CRISPR-imaging platform identifies regulators of hyperplastic and hypertrophic adipose morphology in zebrafish
- Other Figures
- All Figure Page
- Back to All Figure Page
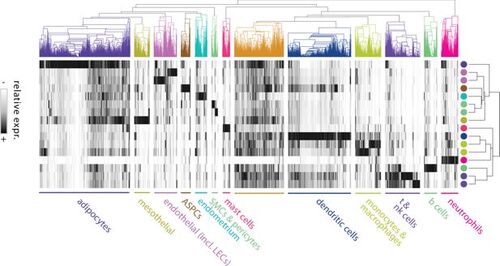
Expression clustering of candidate adipose morphology genes across human white adipose tissue (WAT) cell types. Heatmap showing relative expression (log-normalised counts) of 2980 candidate morphology-associated genes across 16 human WAT cell types from Emont et al., 2022. Genes without annotations or detectable expression in the single-cell dataset were excluded. Hierarchical clustering of genes (rows) and cell types (columns) was performed using average linkage with Pearson correlation distance. Cell types are colour-coded and labelled below: adipocytes, mesothelial cells, endothelial cells (including lymphatic endothelial cells [LECs]), adipose stem and progenitor cells (ASPCs), smooth muscle cells (SMCs) and pericytes, endometrium, mast cells, dendritic cells, monocytes and macrophages, T and natural killer (NK) cells, B cells, and neutrophils. Coloured dots (right) correspond to cell-type identity in the dendrogram (top). |