
Figure 7
- ID
- ZDB-FIG-260427-42
- Publication
- Choi et al., 2026 - 3D imaging with enhanced transparency, signal-to-background ratios, and antigen detection using HyPer-3D
- Other Figures
- All Figure Page
- Back to All Figure Page
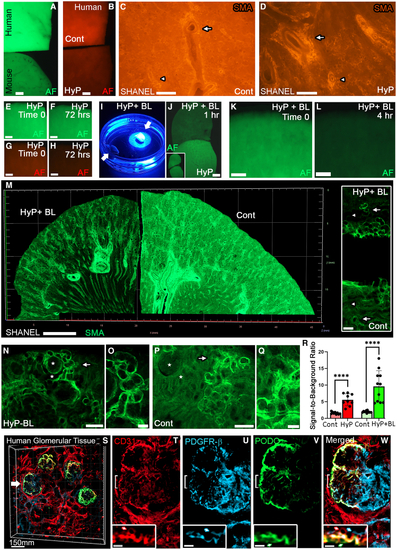
Development and implementation of HyPer-3D for 3D imaging of human tissue with enhanced clarity and SBRs (A) Green AF exhibited by 1 mm sections of murine and human renal cortex, imaged side-by-side for direct comparison. (B) Red AF exhibited by an individual human kidney section split into two halves, with one-half left untreated as a control (Cont) and the other half treated with HyPer-3D (HyP). (C and D) Adjacent kidney sections treated without (Cont) or with HyPer-3D (HyP) were processed using the 3D imaging protocol SHANEL, with IF done for the renal arterial bed (SMA, red). (E and F) Green AF of human kidney (E) before HyPer-3D treatment and (F) 72 h after HyPer-3D treatment. (G and H) Red AF of human kidney section (G) before HyPer-3D treatment and (H) 72 h after treatment with HyPer-3D. (I) HyPer-3D + BL treatment (HyP + BL) on one-half of a bisected kidney (arrows point to each half of the kidney, with second control half kept out of the view of the light). (J) Green AF of murine kidney, with one-half treated with HyPer-3D (HyP) and the other with HyPer-3D + BL for 1 h in the same plate; inset, green AF before treatment. (K and L) Green AF of the human kidney specimen (K) before treatment and (L) 4 h after treatment with HyPer-3D + BL. (M) 3D imaging of human renal arterial bed in the green field (SMA, green), with one-half of a 1 mm kidney section processed by SHANEL (Cont) serving as a control, and the second-half treated with HyPer-3D + BL and then processed by SHANEL (HyP + BL). Inset shows mid-optical slice of 3D stack. Arrows in inset show small caliber vessels in HyP + BL and Cont tissues. Arrowheads in inset point to characteristic nephrogenic background noise. (N–Q) High-magnification images of renal arterial bed in (N and O) HyPer-3D + BL tissues and (P and Q) control tissues. Asterisks in (N) and (P) mark nephrogenic tissue background noise. Arrows in (N) and (P) point to areas seen at high magnification in (O) and (Q) (50 μm), respectively. (R) SBRs exhibited in the red light field (red bars) and green light field (green bars; ∗∗∗∗ (S–W) 3D interrogation of the architecture of (S) the human glomerulus (merged labeled image, arrow points to region shown at high magnification; scale bars, 0.15 mm), including the (T) endothelial (CD31, red), (U) mesangial (PDGFR-β, blue), and (V) podocyte (podocalyxin, PODO, green) tissue compartments. (W) Merged image. Insets in (T)–(W) show high-magnification images of bracketed area. Scale bars are 1 mm (A–L), 0.1 mm (M), 0.2 mm (N–Q), and 10 μm (S–W). |