
Figure 1
- ID
- ZDB-FIG-260427-35
- Publication
- Choi et al., 2026 - 3D imaging with enhanced transparency, signal-to-background ratios, and antigen detection using HyPer-3D
- Other Figures
- All Figure Page
- Back to All Figure Page
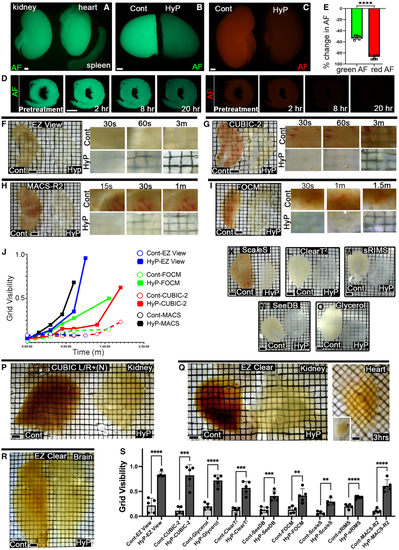
HyPer-3D abolishes tissue AF and increases optical transparency (A) AF of the kidney, heart, and spleen imaged in the same field of view. (B) Green AF exhibited by a single kidney cut into two halves, with one-half treated with HyPer-3D (HyP) and the other serving as an untreated control (Cont). (C) Red AF exhibited by the untreated control (Cont) and HyPer-3D (HyP)-treated kidneys. (D) Time-dependent quenching of green and red AF in 1 mm thick murine heart sections. (E) Quantification of the decrease in green and red AF in the kidney and the heart tissue with HyPer-3D treatment (∗∗∗∗ (F–I) Adjacent 0.5 mm thick sections from a single kidney pretreated with HyPer-3D (HyP) or left as untreated controls (Cont), and then processed with 3D clearing protocols, namely (F) EZ View (also see (J) Quantification of optical transparency of HyP and Cont tissues over time in refractive index-matching solutions, as determined by the underlying grid visibility. (K–O) Adjacent 0.5 mm thick sections treated with HyPer-3D (HyP) or left untreated (Cont), and then incubated with (K) Sca (P) Optical clearing of whole adult murine kidneys with CUBIC L/R + (N). Kidneys were cut into left and right halves, treated with HyPer-3D (HyP) or left untreated (Cont), and then processed with CUBIC L/R + (N). (Q) Optical clearing of adult murine kidney and heart with the EZ Clear method. Kidneys were cut into left and right halves, treated with HyPer-3D (HyP) or left untreated (Cont), and then processed with EZ Clear. (R) Optical clearing of whole adult brains using EZ Clear. Brains were divided into left and right hemispheres, treated with HyPer-3D (HyP) or left untreated (Cont), and then processed using EZ Clear. (S) Quantification of optical transparency, as assessed by the underlying grid visibility, of tissues treated with standard published protocols (Cont) vs. counterpart tissues first pretreated with HyPer-3D (HyP) and then subsequently processed with standard published protocols (∗∗∗∗ AF, autofluorescence. |