
Figure 4
- ID
- ZDB-FIG-260427-38
- Publication
- Choi et al., 2026 - 3D imaging with enhanced transparency, signal-to-background ratios, and antigen detection using HyPer-3D
- Other Figures
- All Figure Page
- Back to All Figure Page
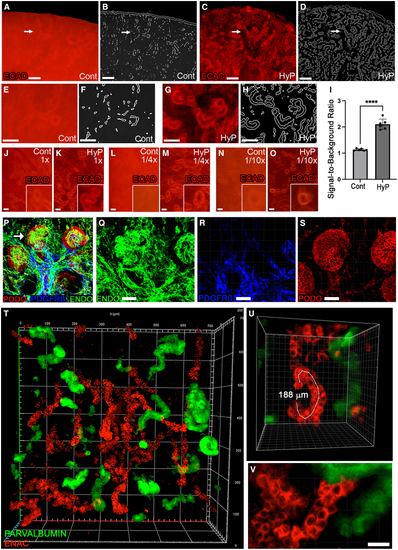
High-throughput and 3D multiplex imaging of highly autofluorescent tissue with enhanced signal discernability and sensitivity (A–D) Adjacent sections of the same kidney were either treated with HyPer-3D (HyP) or left as a control lacking HyPer-3D treatment (Cont). Sections were then formamide/glycerol cleared after immunostaining for ECAD to mark nephrogenic tissues (A and C; scale bars, 50 μm). AI-based autosegmentation of stained renal tubules was performed for both (B) and (D). (E–H) High-magnification views of the regions marked with arrows in (A–D) for both IF stain (E and G) and tubule segmentation (F and H). Scale bars, 25 μm. (I) SBRs of renal tubule staining (∗∗∗∗ (J–O) IF for ECAD marking the renal collecting tubules (ECAD, red) on adjacent Cont and HyP-treated kidney sections, using (J and K) standard published antibody concentrations, (L and M) 4-fold lower antibody concentration, and (N and O) 10-fold lower concentration. Scale bars, 50 μm. (P–S) 3D images of the (P) glomerulus (merged labeled image, arrow points to region shown at high magnification in Q–S), including the (Q) endothelial (endomucin, ENDO, green), (R) mesangial (PDGFR-β, blue), and (S) podocyte (podocalyxin, PODO, red) tissue compartments. All tissue regions were clearly differentiated (also see (T–V) Visualization of connecting (ENAC, red) and distal convoluted (PARVALBUMIN, green) tubule nephron segments of HyPer-3D-treated kidneys cleared with formamide/glycerol (see also ECAD, E-cadherin. |