
Figure 3
- ID
- ZDB-FIG-260427-37
- Publication
- Choi et al., 2026 - 3D imaging with enhanced transparency, signal-to-background ratios, and antigen detection using HyPer-3D
- Other Figures
- All Figure Page
- Back to All Figure Page
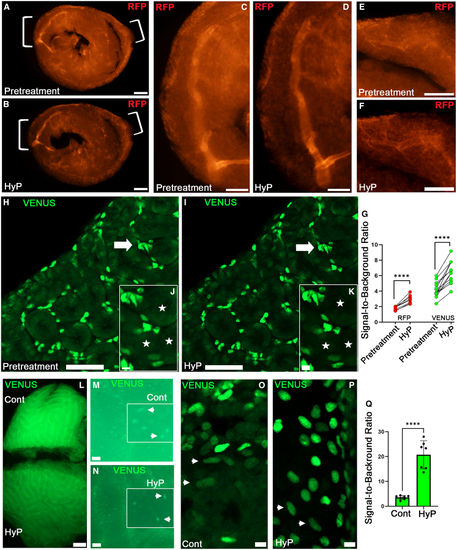
Increased detection and enhanced imaging of transgenic fluorescent reporter proteins using HyPer-3D Imaging of transgenic murine organs expressing different fluorescent proteins without (pretreatment) or with HyPer-3D treatment (HyP). (A–F) Imaging of the same exact heart sections expressing red fluorescent protein (TdTomato) in the vasculature. Brackets in (A) and (B) indicate regions shown at high magnification in (C–F). Scale bars, 0.5 mm (A and B) and 0.25 mm (C–F). (G) Signal-to-background ratios (SBRs) of transgenic fluorescent reporters in tissues (∗∗∗∗ (H–K) Imaging of the same kidney sections expressing Venus green fluorescent protein in interstitial cells surrounding the renal tubules. Arrows in (H) and (I) point to the same tissue regions shown at high magnification in (J) and (K). Asterisks mark centers of renal tubules that exhibit high AF. Scale bars, 50 μm (L–P) Imaging Venus+ cells in testis from (L) Testis expressing Venus in tubular interstitial cells, with Cont and HyP-treated halves shown side-by-side. Scale bars, 0.5 mm. (M and N) Low magnification stereo fluorescence microscopy showed a marked difference in detectable Venus+ cells between Cont and HyP-treated samples (M and N; inset shows higher magnification of Venus+ cells, and arrowheads mark representative cells). Scale bars, 0.2 mm. (O and P) High magnification imaging of Venus+ cells in (O) Cont tissue and (P) HyP-treated tissues. Arrowheads in (O) and (P) mark representative cells exhibiting low Venus+ expression in each condition. Scale bars, 10 μm. (Q) SBRs exhibited by Venus+ tissues (∗∗∗∗ |