
Figure 2
- ID
- ZDB-FIG-260427-36
- Publication
- Choi et al., 2026 - 3D imaging with enhanced transparency, signal-to-background ratios, and antigen detection using HyPer-3D
- Other Figures
- All Figure Page
- Back to All Figure Page
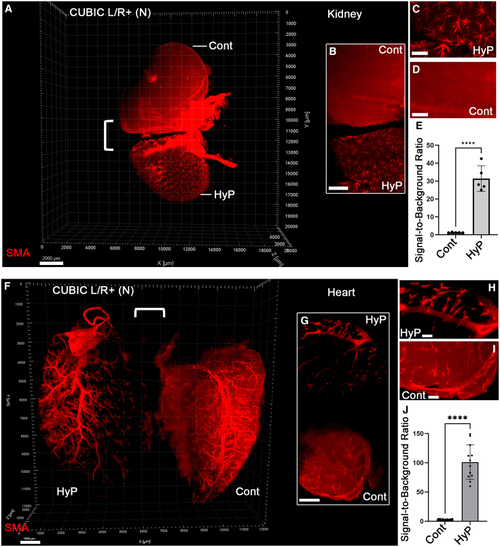
3D imaging with enhanced imaging clarity using HyPer-3D (A–E) 3D light sheet imaging through whole adult murine kidneys, using the CUBIC L/R+ (N) method. (A) IF was performed for the renal arterial bed (SMA, red). One-half of the kidney served as a control and was processed using the standard published protocol (Cont), and second-half was treated with HyPer-3D (HyP) and then subsequently processed using the standard published protocol. Scale bars, 2 mm. Bracket indicates region shown in (B). (B) Mid optical slice of 3D image. Scale bars, 1 mm. (C and D) High magnification of mid optical slice showing the renal arterial bed in Cont and HyP-treated tissue. Scale bars, 0.5 mm. (E) Signal-to-background ratios (SBRs; ∗∗∗∗ (F–I) 3D light sheet imaging through whole adult murine hearts, using the EZ Clear method. (F) IF was performed for the coronary arterial bed (SMA, red). Hearts were bisected and processed as above. Scale bars, 1 mm. Bracket indicates the region shown in (G). (G) Mid optical slice of 3D image. Scale bars, 1 mm. (H and I) High magnification of mid optical slice showing the coronary arterial bed in Cont and HyP-treated heart tissues. Scale bar, 0.5 mm. (J) SBRs exhibited by the control and HyPer-3D-treated hearts (∗∗∗∗ IF, immunofluorescence. |