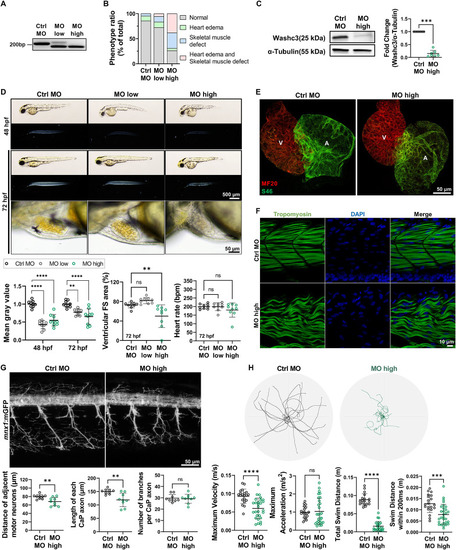
Knockdown of Washc3 in zebrafish embryo impairs neuromuscular development and cardiac function. (A) RT-PCR bands of washc3 in control (ctrl) or washc3 morpholino (MO) injected embryos at 72 h post-fertilization (hpf), validating MO against zebrafish washc3 inducing deletion of 39 bp at the end of exon 2 via alternative splicing (MO-low: 250 μM of washc3 MO; MO-high: 500 μM of washc3 MO). (B) Phenotype ratios of ctrl or washc3 morphants at 72 hpf (% of Normal, Heart edema, Skeletal muscle defect, Heart edema and skeletal muscle defect). (C) Immunoblots of Washc3 and α-Tubulin (a loading control) in ctrl or washc3 morphants at 72 hpf. The blot intensity of Washc3 was normalized to α-Tubulin and fold change was calculated vs. ctrl morphants (SD, n = 7, Mann- Whitney test, ***p < 0.001 vs. Ctrl MO). (D) Lateral view of MO-injected embryos at 48 and 72 hpf in the images of brightfield (top panel) or birefringence (bottom panel) (scale bar: 500 µm). Magnified brightfield images of morphants' developing hearts showing unaffected cardiac phenotype by washc3 MO at 72 hpf (scale bar: 50 µm). Quantified birefringence intensities, representing skeletal muscle development, were significantly decreased in washc3 morphants at 48 and 72 hpf (SD, n = 9, Ordinary one-way ANOVA, **p < 0.005, ****p < 0.0001 vs. Ctrl MO). Heart function was assessed by measuring ventricular fractional shortening (FS) area (SD, n = 9, Ordinary one-way ANOVA, ns = not significant, **p < 0.005 vs. Ctrl MO) and heart rate (bpm: beats per minute) (SD, n = 9, Ordinary one-way ANOVA, ns = not significant vs. Ctrl MO). At 72 hpf, cardiac contractility was significantly reduced in washc3 MO-high injected embryos. (E) Immunofluorescence (IF) staining of chamber-specific myosin heavy chain staining (MF20: ventricle and atrium, S46: atrium) for defining chamber specification and differentiation of morphants at 72 hpf (scale bar: 50 μm). (F) Confocal projections of morphants stained with Tropomyosin (green) and DAPI (blue) at 48 hpf (scale bar: 10 μm). (G) Representative confocal images visualizing the motor neuron in Tg(mnx1:mGFP) embryos injected with ctrl or washc3 MO at 72 hpf. Statistical analyses revealed significantly decreased quantification of distance of adjacent motor neuron (SD, n = 9; Unpaired t-test, **p < 0.005 vs. Ctrl MO) and length of each CaP axon (SD, n = 9, Unpaired t-test, **p < 0.005 vs. Ctrl MO), but number of branches per CaP axon (SD, n = 9; ns = not significant vs. Ctrl MO) was not affected by MO-mediated knockdown of Washc3. (H) Overlaid swim paths of MO-injected embryos from touch evoked escape response assay demonstrates deteriorated motility of washc3 morphants at 72 hpf. Statistical analyses of maximum velocity (m/s, SD; Ctrl MO, n = 20; MO-high, n = 28; Unpaired t-test, ****p < 0.0001 vs. Ctrl MO), maximum acceleration (m/s2, SD; Ctrl MO, n = 20; MO-high, n = 29; Mann–Whitney test, ns = not significant vs. Ctrl MO), total swim distance (m, SD; Ctrl MO, n = 18; MO-high, n = 24; Mann–Whitney test, ****p < 0.0001 vs. Ctrl MO), and swim distance within 200 ms (m, SD; Ctrl, n = 20; MO-high, n = 29; Unpaired t-test, ***p < 0.001 vs. Ctrl MO).
|
