FIGURE

Figure 4

ID
ZDB-FIG-260311-690
Publication
Kim et al., 2026 - WASHC3 knockout disrupts mitochondrial protein homeostasis and energy metabolism in cardiomyocytes
Other Figures
All Figure Page
Back to All Figure Page
Figure 4

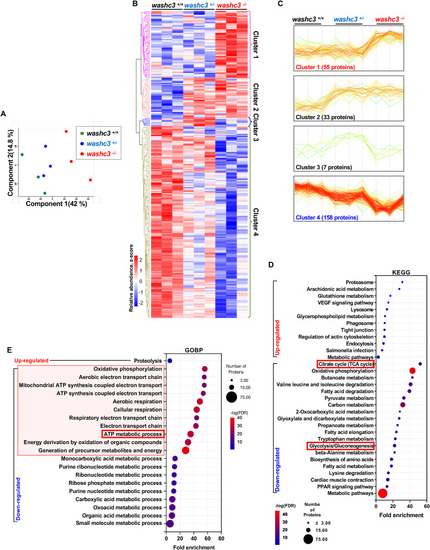
Proteomic analysis reveals downregulated mitochondrial proteins and ATP production related pathways in washc3 knockout adult zebrafish heart. (A) Dot plot shows principal component analysis (PCA) of proteomics data from three biological replicates of heart-specific protein lysates in washc3+/+, washc3+/−, and washc3−/− at 1 year old. (B) Unsupervised hierarchical clustering analysis (Heatmap) of 253 differently expressed protein. Each cluster was labelled by colors and numbers on the right side of the heatmap. (C) Representative images show distinct profiles of the clustered protein expression. Cluster 1 and 4 are highlighted by colors (red: up-regulated in washc3−/−, blue: down-regulated in washc3−/−) for the further analysis. (D,E) Gene ontology (GO) enrichment and KEGG pathway analysis of proteins clustered in (B) by ShinyGO 0.82 analyzer. Plots show pathways of GO terms Biological Process (BP) and KEGG pathways (cut off, *p < 0.05). The size of the circle represents the number of differently expressed proteins in each pathway category. The color of the circle indicates False discovery rate (FDR) as p-values and X-axis denotes Fold Enrichment.

Expression Data

Expression Detail
Antibody Labeling
Phenotype Data

Phenotype Detail
Acknowledgments
This image is the copyrighted work of the attributed author or publisher, and ZFIN has permission only to display this image to its users. Additional permissions should be obtained from the applicable author or publisher of the image. Full text @ Front Cardiovasc Med