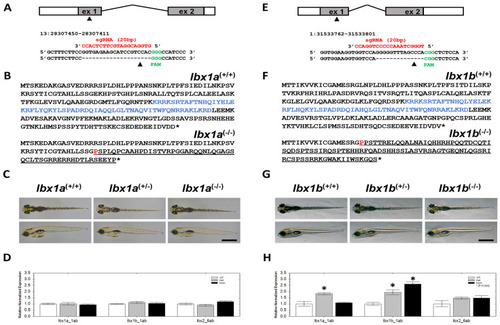
The generation of lbx1a and lbx1b loss-of-function lines. (A) The targeting site in exon 1 of the lbx1a gene and the sequence of the guide RNA used. (B) The wildtype protein sequence of Lbx1a (upper sequence) and truncated protein sequence after the targeting event (lower sequence). (C) Phenotypic appearances of lbx1a(+/+), lbx1a(+/−), and lbx1a(−/−) animals. Upper row dorsal view, lower row side view. Note that no obvious phenotype is visible. (D) The relative normalized expression of lbx1a, lbx1b, and lbx2 in lbx1a(+/+), lbx1a(+/−), and lbx1a(−/−) animals using qPCR. (E) The targeting site in exon 1 of the lbx1b gene and the sequence of the guide RNA used. (F) The wildtype protein sequence of Lbx1b (upper sequence) and truncated protein sequence after the targeting event (lower sequence). (G) Phenotypic appearances of lbx1b(+/+), lbx1b(+/−), and lbx1b(−/−) animals. Upper row dorsal view, lower row side view. Note that no obvious phenotype is visible. (H) The relative normalized expression of lbx1a, lbx1b, and lbx2 in lbx1b(+/+), lbx1b(+/−), and lbx1b(−/−) animals using qPCR. (B,F) The sequence highlighted in blue indicates the homeobox domain. Group differences were calculated with ANOVA test, p > 0.05 *.
|
