FIGURE

Figure 4

ID
ZDB-FIG-251225-43
Publication
Drepper et al., 2025 - Hyperactivity and Differential Gene Expression in lbx1a(-/-) Zebrafish Larvae
Other Figures
All Figure Page
Back to All Figure Page
Figure 4

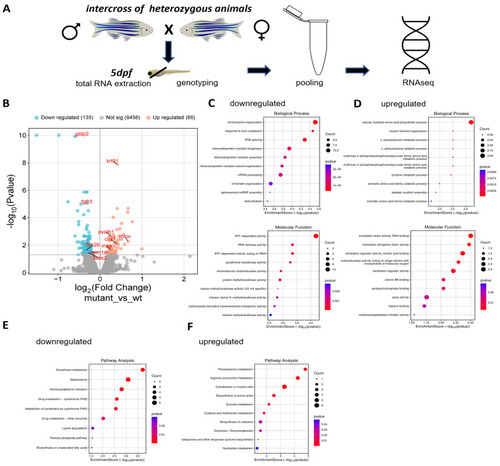
Differentially expressed genes in the head region of lbx1a(−/−) larvae. (A) The experimental outline of the expression profiling. Note the site of separation of the head and trunk region of the animals. The head region was used for expression profiling and the trunk for genotyping. (B) The volcano plot of the experiment. One hundred thirty-five genes were downregulated, sixty-six upregulated. (C) The GO term enrichment analysis of the downregulated genes for biological processes (upper panel) and molecular function (lower panel). (D) The GO term enrichment analysis of the upregulated genes for biological processes (upper panel) and molecular function (lower panel). (E) The pathway enrichment analysis for the downregulated genes. (F) The pathway enrichment analysis for the upregulated genes.

Expression Data

Expression Detail
Antibody Labeling
Phenotype Data

Phenotype Detail
Acknowledgments
This image is the copyrighted work of the attributed author or publisher, and ZFIN has permission only to display this image to its users. Additional permissions should be obtained from the applicable author or publisher of the image. Full text @ Cells