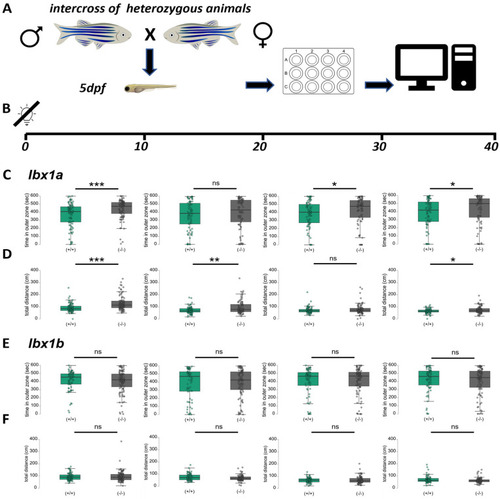
Thigmotaxis and hyperactivity in lbx1a(−/−) but not in lbx1b(−/−) mutants. (A) The experimental outline and test arena for thigmotaxis place preference with the virtual division of analysis zones in the 12-well format. The central zone indicates exposed area and the outer zone defensive preferences. (B) An experimental outline for the 40 min assay and analysis in groups of 10 min. (C) Thigmotaxis behavior in the lbx1a line shown as time in outer zone. Note that in the first 10 min significant differences in thigmotaxis behavior between genotypes are visible (Mann–Whitney p < 0.001, effect size 0.312 ± 0.086), which later decreases. (D) Hyperactivity in the lbx1a line shown as total distance traveled in 10 min. Note that in the first 10 min, strong differences between genotypes are visible (Mann–Whitney p < 0.001, effect size 0.455 ± 0.086), which later decreases. (E) The place preference analysis in the lbx1b line shown as time in outer zone. Note that no significant differences between genotypes are visible. (F) No hyperactivity in lbx1b(−/−) animals detectable. Data from 4 independent experiments with in total 80 to 100 animals per genotype. Data analyzed with a two-tailed Mann–Whittney test with p < 0.05 *, p < 0.01 ** and p < 0.001 ***.
|
