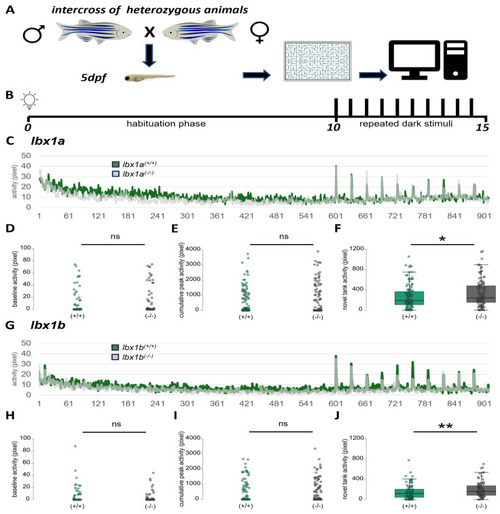
Similar reaction in repeated dark stimulus assay in lbx1a(−/−) and lbx1b(−/−) mutants. (A) The experimental outline and test arena for the repeated dark stimulus assay in a 96-well format. (B) The experimental outline for the 15 min assay with a 10 min habituation phase and 10 stimuli for one second and 30 s of interstimulus interval. (C) The activity plot over the experiment. Activity is measured in pixel intensity change and is shown for lbx1a(+/+) animals (green) and lbx1a(−/−) animals (gray). Note the strong reaction to the dark stimuli. (D) Baseline activity 10 s prior to the first stimulus. (E) The cumulative peak activity of the first 3 s after each peak summed up over all 10 stimuli. (F) The activity of the first 10 s of the experiment. Note the increased activity of the lbx1a(−/−) animals (Mann–Whitney p = 0.037, effect size 0.160 ± 0.076). (G) The activity plot over the experiment. Activity is measured in pixel moved and is shown for lbx1b(+/+) animals (green) and lbx1b(−/−) animals (gray). (H) Baseline activity 10 s prior to the first stimulus. (I) The cumulative peak activity of the first 3 s after each peak summed up over all 10 stimuli. (J) The activity of the first 10 s of the experiment. Note the increased activity of the lbx1b(−/−) animals (Mann–Whitney p = 0.006, effect size 0.248 ± 0.089). Data analyzed with a two-tailed Mann–Whitney test with p < 0.05 * and p < 0.01 **.
|
