
Figure 1
- ID
- ZDB-IMAGE-251225-41
- Genes
- Publication
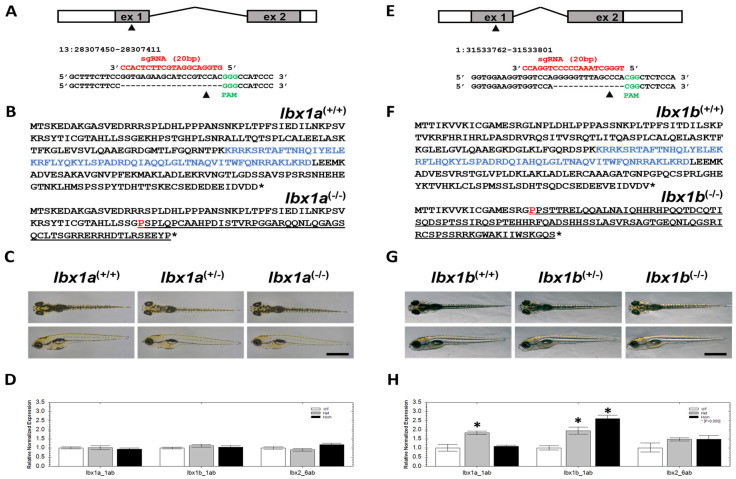
- Drepper et al., 2025 - Hyperactivity and Differential Gene Expression in lbx1a(-/-) Zebrafish Larvae
- All Figures
- Figures for Drepper et al., 2025
|
Figure 1
The generation of