|
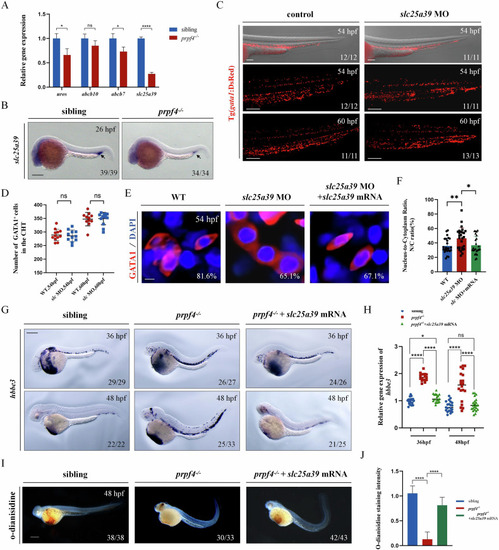
slc25a39 downregulation in prpf4 mutants blocks erythrocyte maturation. A RT-qPCR analysis of gene expression in GATA1+ erythrocytes at 48 hpf. B Expression of slc25a39 in siblings and prpf4−/− embryos at 26 hpf, detected by in situ hybridization. Scale bar: 200 µm. C, D Effect of slc25a39 knockdown on GATA1+ erythrocytes in Tg(gata1:DsRed) embryos. C Confocal images showing GATA1+ cells in the CHT region of control and slc25a39 MO-injected embryos at 54 hpf and 60 hpf. Scale bar: 100 µm. D Quantification of the number of GATA1+ cells in the CHT region. E, F Effect of slc25a39 knockdown on erythrocytes morphology in Tg(gata1:DsRed) embryos at 54 hpf. E Confocal images showing the morphology of GATA1+ cells in control, slc25a39 MO-injected, and slc25a39 MO + mRNA co-injected embryos. Scale bar: 20 µm. F Quantitative analysis of the nuclear-to-cytoplasmic (N/C) ratio of individual cells measured from (E). WT (n = 25), slc25a39 MO (n = 27), slc25a39 MO + mRNA (n = 24). G WISH analysis of hbbe3 at 36 hpf shows the staining patterns in sibling, prpf4−/−, and prpf4−/− embryos co-injected with slc25a39 mRNA. Scale bar: 200 µm. H Quantification of hbbe3 staining intensity in the CHT region at 36 hpf reveals significantly higher staining intensity in prpf4−/− embryos compared with sibling embryos. Co-injection of slc25a39 mRNA significantly reduces the staining intensity in prpf4−/− embryos. I, J Effect of slc25a39 mRNA injection on hemoglobin levels in prpf4−/− embryos at 48 hpf. I Images of o-dianisidine staining in WT, prpf4−/−, and prpf4−/− embryos injected with slc25a39 mRNA. Scale bar: 200 µm. J Quantification of o-dianisidine staining intensity. Hemoglobin levels are significantly reduced in prpf4−/− embryos compared with WT, while slc25a39 mRNA injection partially restores hemoglobin levels in prpf4−/− embryos. Scale bar: 100 µm.
|