FIGURE

Fig. 5

ID
ZDB-FIG-251210-50
Publication
Deng et al., 2025 - Prpf4 sequentially regulates the expansion and maturation of erythrocyte through distinct mechanisms
Other Figures
All Figure Page
Back to All Figure Page
Fig. 5

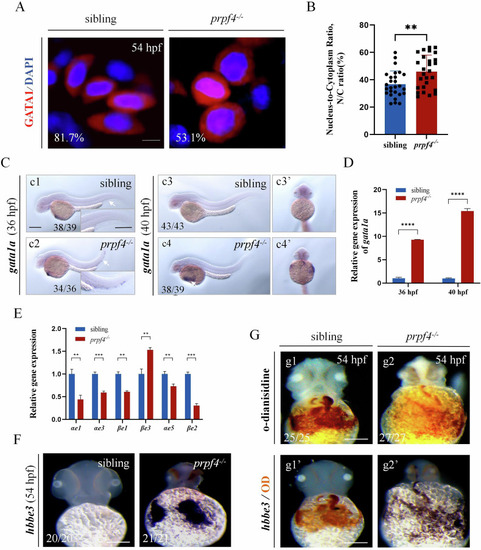
The maturation of erythrocytes is disturbed in prpf4 mutants.

A, B Morphological analysis of erythrocytes in siblings and prpf4−/− embryos at 54 hpf. A Representative confocal images showing GATA1+ cells stained with DAPI in siblings and prpf4−/− embryos. In sibling embryos, 81.7% of erythrocytes exhibit an oval morphology, while in prpf4−/− embryos, 53.1% of erythrocytes display a round morphology. The presented images represent typical erythrocyte morphologies observed in each group. Scale bar: 20 µm. B Quantification of the nuclear-to-cytoplasmic (N/C) ratio of individual GATA1+ cells (30 embryos per group). C WISH analysis of gata1a expression in siblings and prpf4−/− embryos at 36 hpf and 40 hpf. Lateral views (c3, c4) and ventral views (c3’, c4’). Scale bar: 200 µm. D Relative expression of gata1a in prpf4−/− mutants and siblings at 36 hpf and 40 hpf, as determined by RT-qPCR. E RT-qPCR analysis of erythroid-related gene expression in siblings and prpf4−/− embryos. F WISH analysis of hbbe3 expression in siblings and prpf4−/− embryos at 54 hpf. G Combined analysis of hbbe3 expression and hemoglobin levels in embryos. g1, g2 O-dianisidine staining reveals reduced hemoglobin levels in prpf4−/− embryos compared to siblings. g1′, g2′ Whole-mount in situ hybridization for hbbe3 performed on the same embryos as in (g1) and (g2). Scale bars: 100 µm (F,G).

Expression Data

Expression Detail
Antibody Labeling
Phenotype Data

Phenotype Detail
Acknowledgments
This image is the copyrighted work of the attributed author or publisher, and ZFIN has permission only to display this image to its users. Additional permissions should be obtained from the applicable author or publisher of the image. Full text @ Cell Death Discov