|
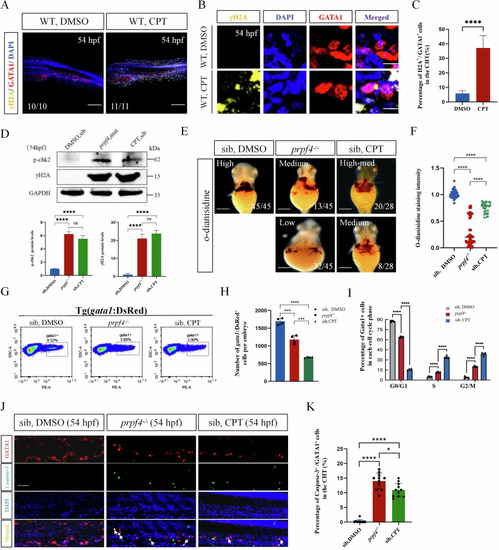
DNA damage-induced ATM/Chk2-p53 pathway partially mediates erythrocyte defects in prpf4 mutants. A-C DNA damage examination in erythrocytes in the CHT region at 54 hpf. A Confocal images showing γH2AX (yellow) staining in WT (DMSO) and WT embryos treated with camptothecin. Scale bar: 200 µm. B High-magnification images of γH2AX and GATA1 colocalization in erythrocytes. Scale bar: 50 µm. C Quantitative analysis of γH2AX-positive cells among GATA1-positive cells in the CHT region. D Western blot analysis of p-Chk2 and γH2AX levels in 54 hpf embryos. Densitometric quantification of p-Chk2 and γH2AX protein levels is shown below. E, F Hemoglobin levels in 60 hpf embryos assessed by o-dianisidine staining. E Hemoglobin staining intensity in siblings treated with DMSO, prpf4−/− embryos, and camptothecin-treated siblings. Staining intensity is categorized as high, medium, or low. Scale bar: 100 µm. F Quantitative analysis of o-dianisidine staining intensity. G–I FACS analysis of GATA1+ erythrocytes in Tg(gata1:DsRed) embryos at 54 hpf. G The percentage of GATA1+ cells in DMSO-treated siblings, prpf4−/− embryos, and camptothecin-treated siblings (30 embryos per group). H Quantification of the total number of GATA1+ cells per embryo. I Cell cycle distribution of GATA1+ cells. Prpf4−/− embryos and camptothecin-treated siblings exhibit cell cycle arrest. J, K Detection of apoptosis in GATA1+ erythrocytes in the CHT region of 54 hpf embryos. J Confocal microscopy images showing active Caspase-3 staining in DMSO-treated siblings, prpf4−/− embryos, and camptothecin-treated siblings. Merged images highlight apoptotic signals (arrows) in GATA1+ cells. Scale bar: 50 µm. K Quantification of the percentage of active Caspase-3+ cells among GATA1+ cells in the CHT region. Both prpf4−/− embryos and camptothecin-treated siblings show a significant increase in apoptosis compared with DMSO-treated siblings.
|