|
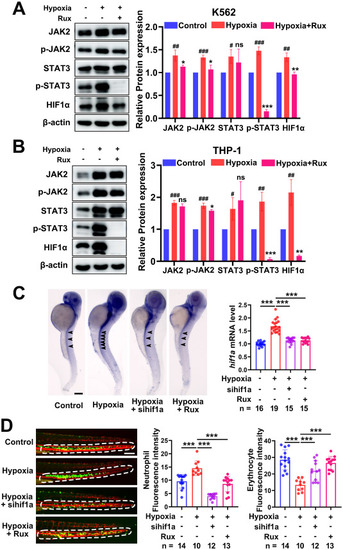
Hypoxia induces a bias in erythroid-myeloid hematopoietic differentiation via the Jak2/Stat3-Hif1a axis. (A) Western blot and quantitative analysis of protein expression in K562 cells with different treatments (n = 3). (B) Western blot and quantitative analysis of protein expression in THP-1 cells with different treatments (n = 3). (C) WISH images and quantitative analysis of hif1a expression in zebrafish larvae under various conditions. (D) Images of Tg(gata1a:DsRed; lyz:EGFP) zebrafish larvae. Quantitative analysis of neutrophils and erythrocytes in the CHT. In C-D, n = replicates per group. ∗∗∗P < 0.001.
|