
FIGURE
Fig. 5
Fig. 5
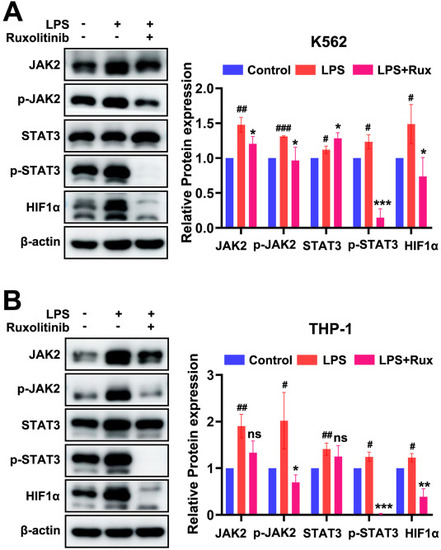
Analysis of JAK2/STAT3-HIF1α pathway protein expression. (A) Western blot and quantitative analysis of JAK2, p-JAK2, STAT3, p-STAT3, and HIF1α protein levels in K562 cells under various treatments (n = 3). (B) Western blot and quantitative analysis of JAK2, p-JAK2, STAT3, p-STAT3, and HIF1α protein levels in THP-1 cells under various treatments (n = 3). Compared with the control group, #p < 0.05, ##p < 0.01, ###p < 0.001. Compared with the LPS group, ∗p < 0.05; ∗∗p < 0.01; ∗∗∗p < 0.001. ns indicates no significant difference. |
Expression Data
Expression Detail
Antibody Labeling
Phenotype Data
Phenotype Detail
Acknowledgments
This image is the copyrighted work of the attributed author or publisher, and
ZFIN has permission only to display this image to its users.
Additional permissions should be obtained from the applicable author or publisher of the image.
Full text @ Fish Shellfish Immunol.