
Fig. 9
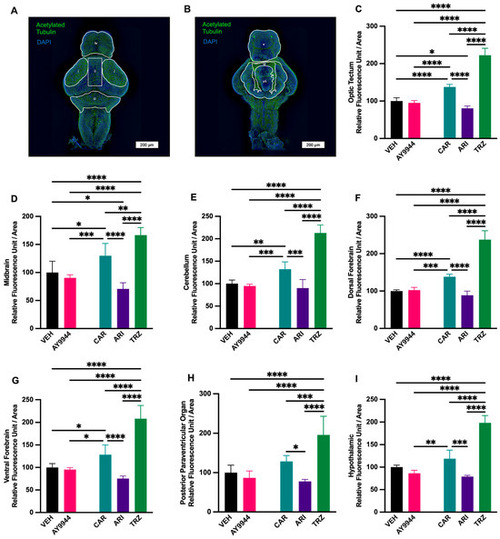
(A–I) Acetylated tubulin immunoreactivity is significantly affected in regions of the zebrafish brain following AY9944 and psychopharmaceutical exposure. Measurements were taken from the dorsal (A) and ventral (B) view. Images were enhanced for viewing. Analyses were performed on raw images. Acetylated tubulin RFUs/area ratio was calculated for each brain region. Measurement i: outlines the optic tectums. Measurement ii: outlines the midbrain region between the two optic tectums. Measurement iii: outlines the cerebellum. Measurement iv: outlines the forebrain from the dorsal side. Measurement v: outlines the forebrain from the ventral side. Measurement vi: outlines the posterior paraventricular organ. Measurement vii: outlines the hypothalamic region. Scale bar = 200 µm. Acetylated tubulin intensity in the optic tectal (C), midbrain (D), cerebellum (E), dorsal forebrain (F), ventral forebrain (G), posterior paraventricular organ (H), hypothalamic regions in AY9944, psychopharmaceutical treatments, and VEH treated zebrafish. N ≥ 5 zebrafish. * p < 0.05, ** p < 0.01, *** p < 0.001, **** p < 0.0001, determined by one-way ANOVA followed by Tukey’s post hoc HSD. VEH = 0.1% DMSO, AY9944 = positive control, CAR = Cariprazine, ARI = Aripiprazole, TRZ = Trazodone. Error Bars = 95% confidence intervals. |